How dashboards transform national ID programs and build trust
 by Rahul Gupta, Mohak Srivastava, Swastik Das and Debarshi Chakraborty
 Feb 24, 2026
 4 min
4 min
At MSC, we see dashboards as powerful governance tools for national ID systems. They convert transaction data into clear insights, help diagnose authentication failures, and guide timely action. Through dashboards, we also reduce the risk of exclusion and strengthen accountability, which ultimately allows us to build greater trust in digital identity programs for the people who need them most.
In our previous blog, we introduced the transaction-level observability framework. Through this governance architecture, national ID authorities can see, diagnose, and act on authentication failures at the point where inclusion or exclusion occurs. This blog presents the dashboards that bring the framework to life, drawn from our work with a national ID authority.
These dashboards are not reporting tools but decision-support systems that transform transaction data into actionable governance. The dashboards serve as concrete examples of the framework in action. These tools translate signals into insights and reaffirm that the framework itself is a governance capability.
The overview dashboard provides holistic system performance
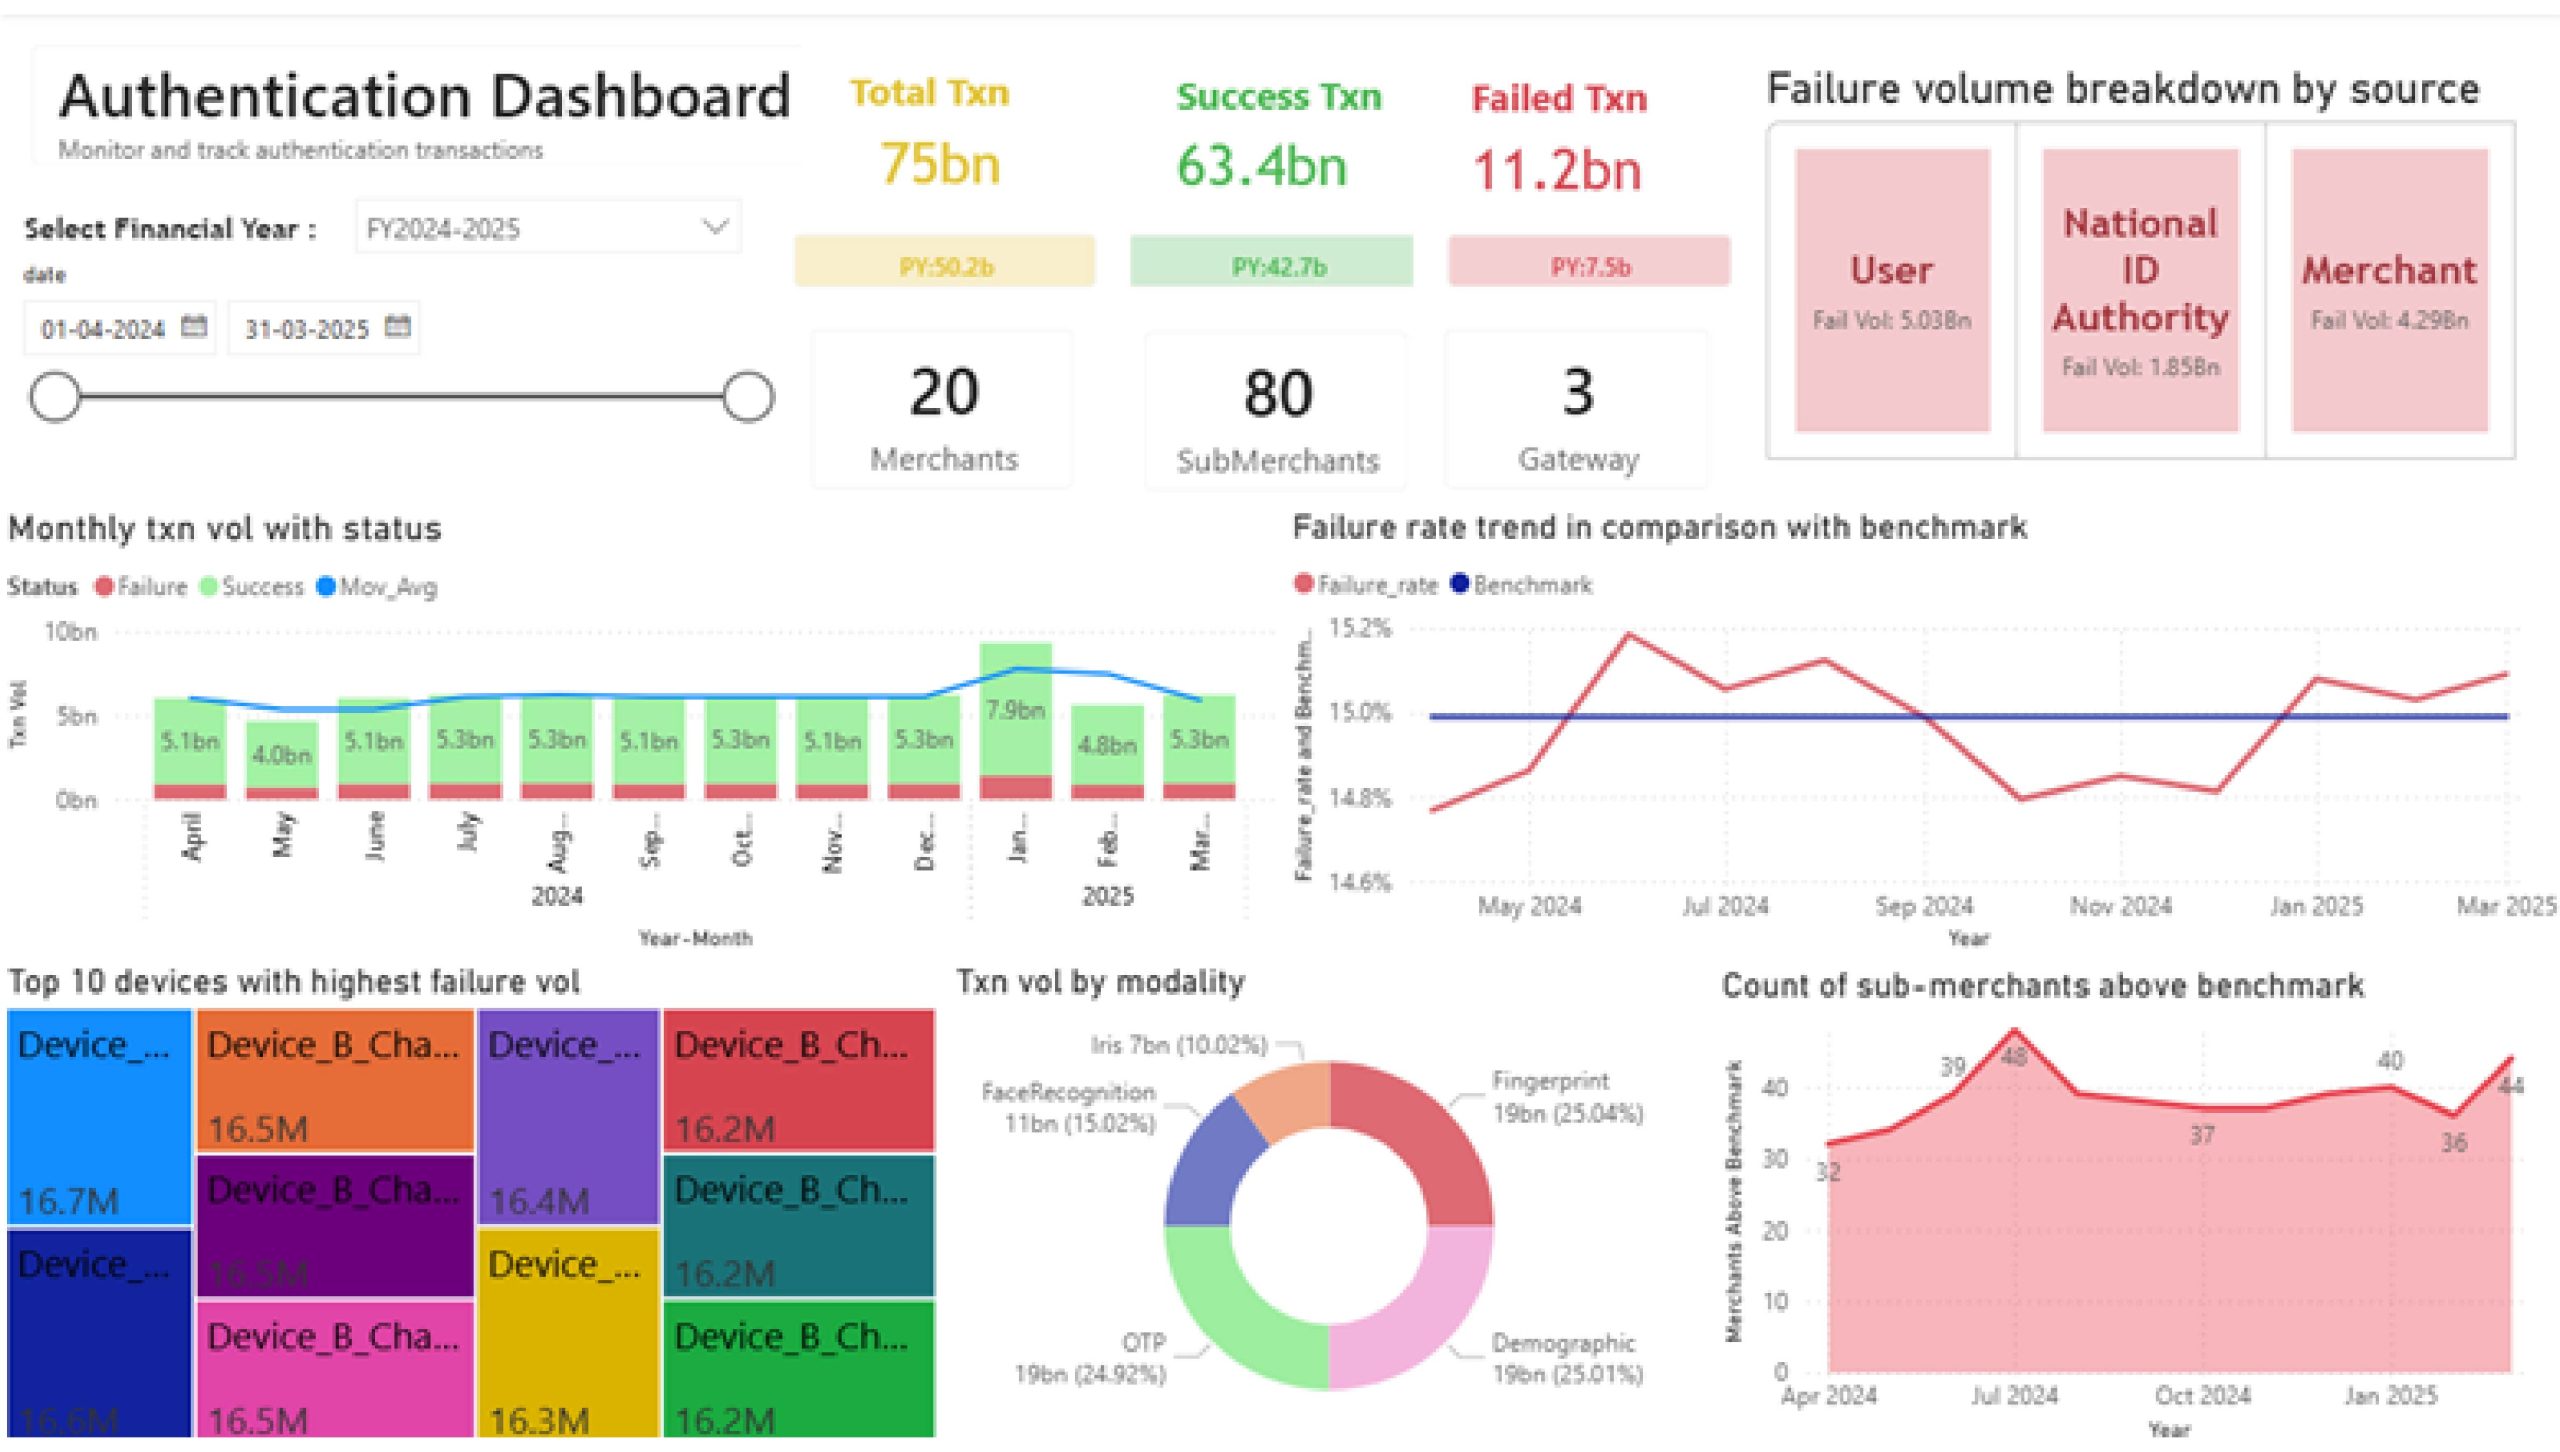
Figure 1: Authentication dashboard that presents transaction-level visibility across service touchpoints
The headline metrics in the above figure provide the most vital information at an overall national level, which include the number of total transactions, the number of successful transactions, and the number of failed transactions. The dashboard also tracks the key active players of the national ID ecosystem, specifically requesting entities and their sub-entities, which the dashboard labels as merchants and sub-merchants, along with service agencies. Together, these key performance indicators (KPIs) in the top panel provide a quick overview of the scale, performance, and players of the authentication ecosystem.
The failure volume broken down by source on the extreme right attributes failures to their source, namely, user-side errors, national ID authority issues, and merchant-side problems. This distribution is critical, as it can reveal the point of origin for most failures.
The stacked bar chart in the middle left provides the number of successful and failed authentication transactions per month. This enables regulators to identify trends and seasonal patterns in transaction volumes. The failure rate trend chart on the middle right shows that the system operates near a 15% failure rate benchmark. In the above illustrative figure, the average monthly failure rate was chosen as the benchmark. However, regulators can adjust the benchmark number as per their requirements.
The bottom-left heatmap identifies the top 10 devices with the highest failure volumes. This data enables targeted device replacement or maintenance. The pie chart at the bottom center shows transaction volume by authentication mode, which includes fingerprint, iris, and OTP, among others. This distribution helps identify which authentication methods may be underperforming. The sub-merchant benchmark chart at the bottom right tracks how many entities exceed the acceptable failure thresholds over time, which serves as a leading indicator of systemic problems.
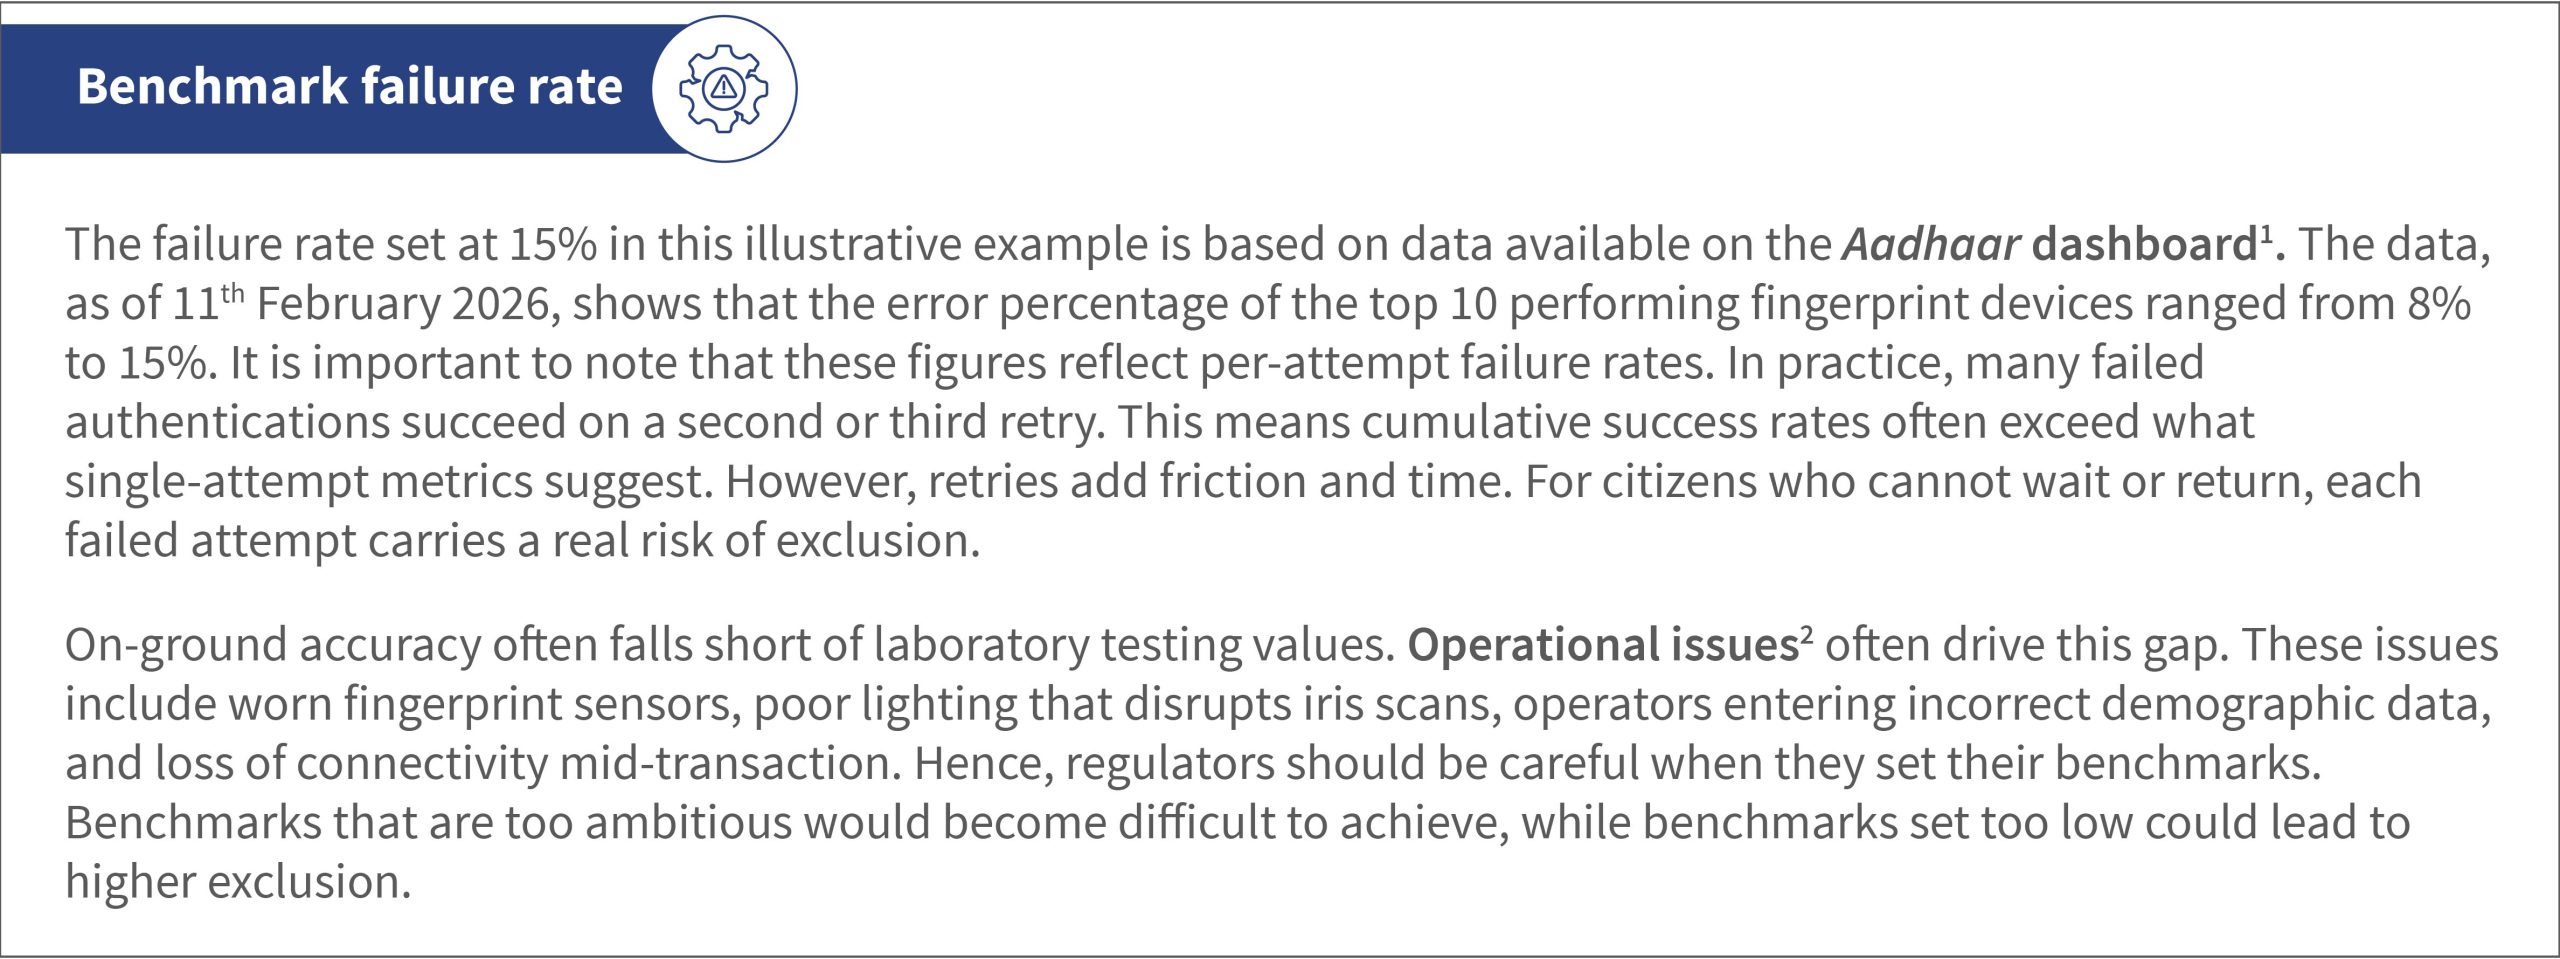
1- Aadhaar dashboard
2. Operational issues
The merchant performance view ensures analysis from signals to diagnosis
The overview dashboard shows that authentication failures exceed acceptable thresholds and cluster around specific devices or time periods, but does not explain why. The addition of a merchant performance view can address this gap, as it would allow regulators to examine error patterns for specific requesting entities. Decision-makers can identify top error reasons for a merchant and disaggregate them by device type or authentication modality. This granularity distinguishes between failures caused by overstressed hardware, poorly configured systems, or process gaps. This feature enables targeted interventions, such as device replacement or operator retraining, rather than system-wide responses.
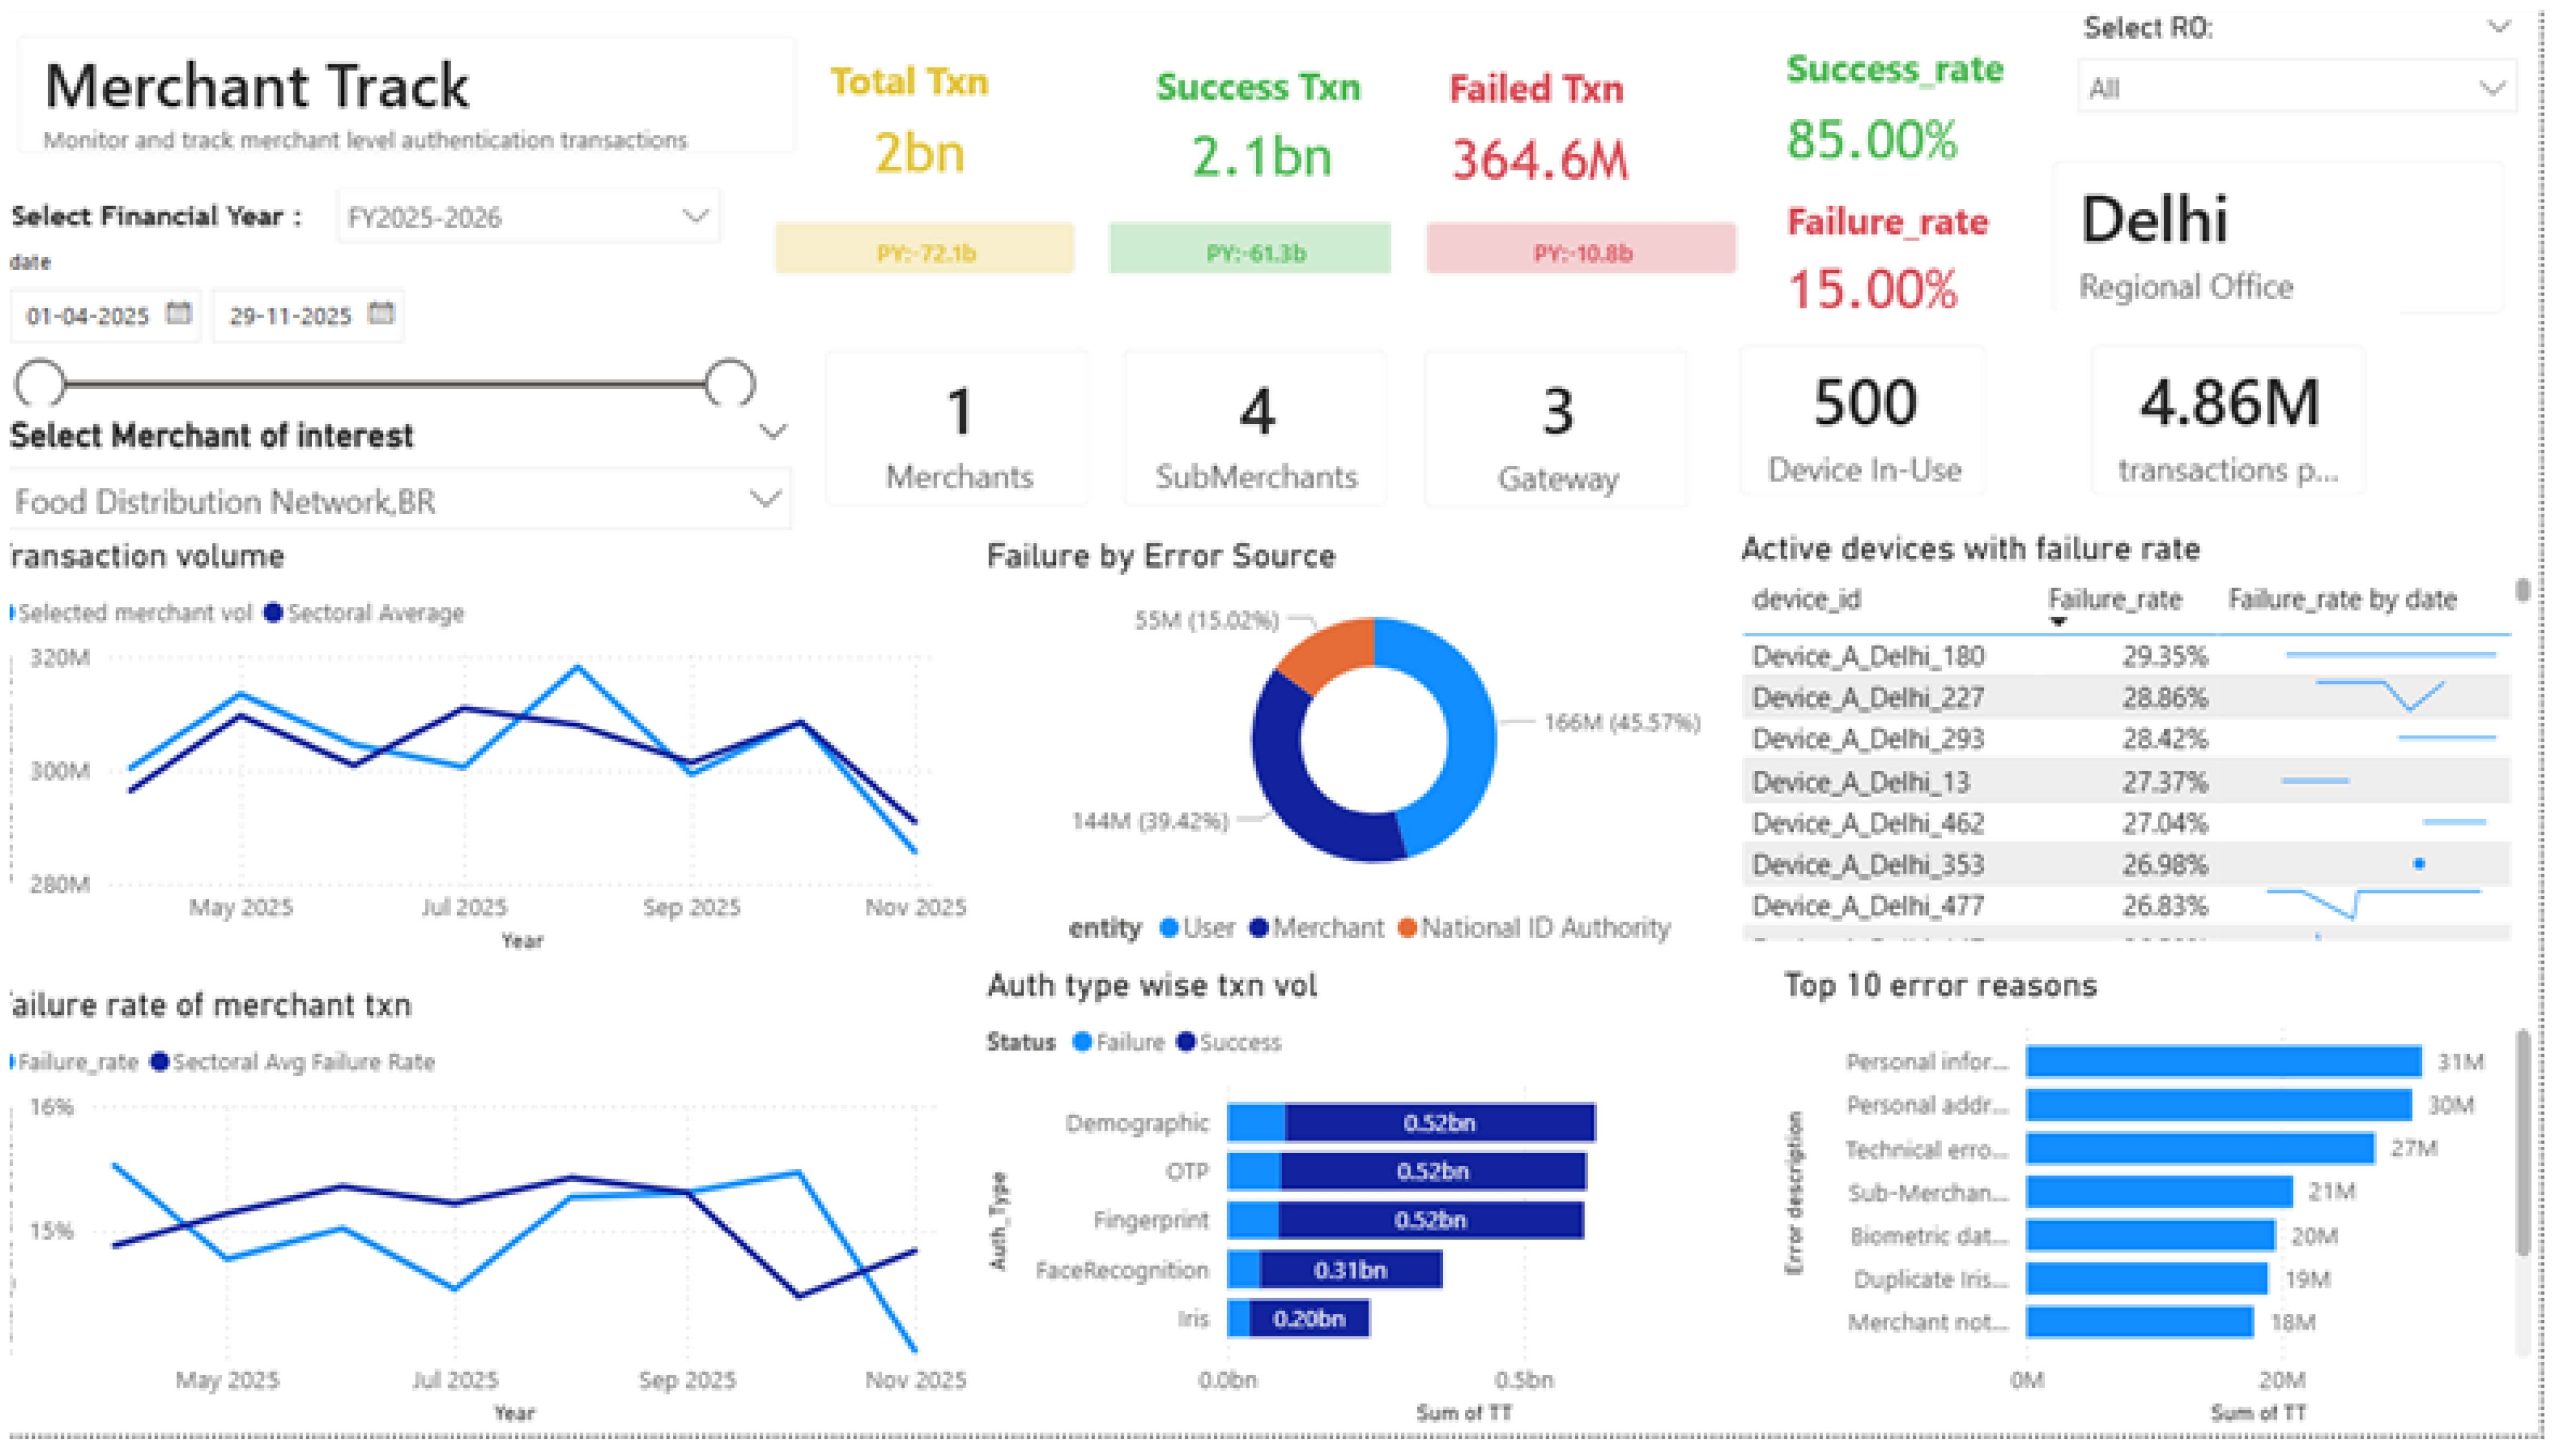
Figure 2: Merchant performance view that enables a detailed analysis by entity, device, and error type
The error analysis view allows a complete picture
An error analysis view completes the diagnostic picture. It attributes failures to responsible parties and specific error categories. It reveals where accountability lies, rather than only show what failed. Recurrent patterns emerge when we examine the error analysis alongside the overview and merchant views. Persistent device-level failures may indicate a need for hardware upgrades, high user-driven errors may signal training gaps, and concentrated failures among specific entities can trigger focused audits. These interventions become evidence-based, grounded in structured observability that transforms dashboards from passive reporting artifacts into decision-support systems.
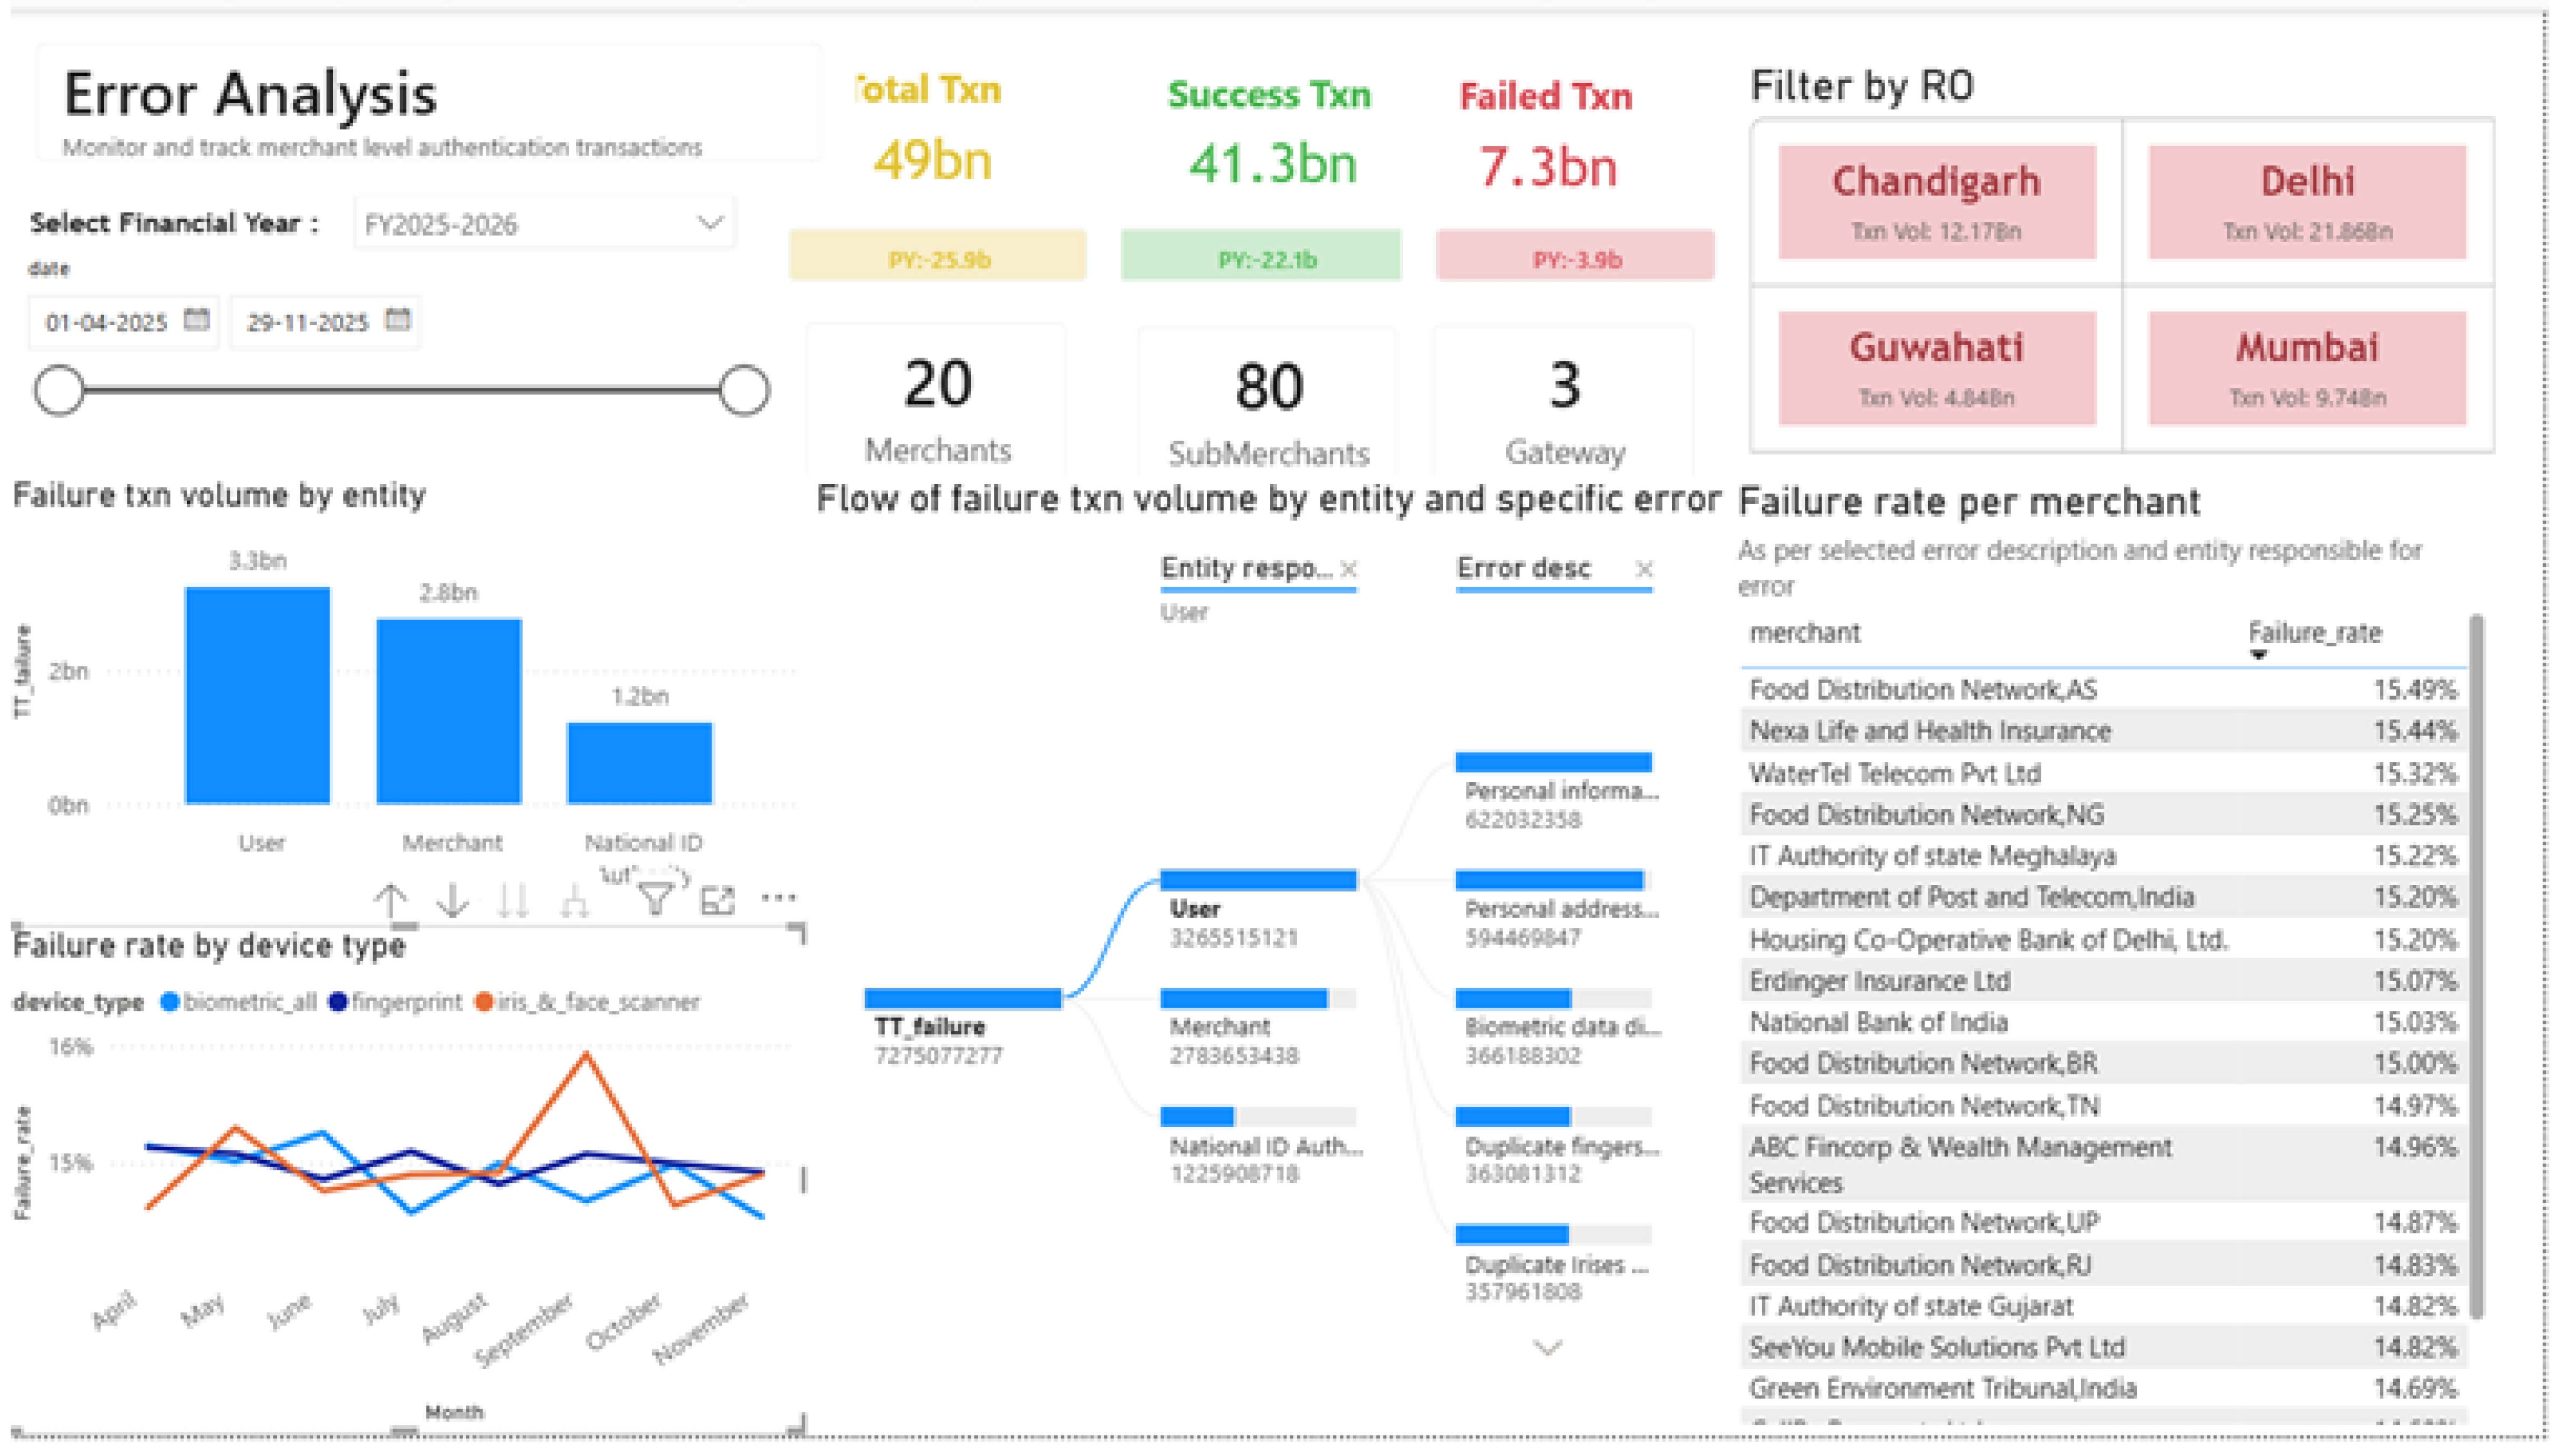
Figure 3: Error analysis view that attributes failures to the responsible entities and error categories
For a more detailed view on how these dashboards can be used interactively, click the link to this video walkthrough.
When auditors can scrutinize transaction patterns, it changes what operators can ignore, what entities can explain, and what policy units can correct. It shifts the system from “trust us” to “show us” and creates a trail of evidence that supports investigation, escalation, and remedial action.
Priority actions for national ID authorities
For national ID authorities that seek to implement transaction-level observability, we recommend four priority actions:
- Capture data comprehensively: The authorities should capture transaction data at every authentication point, which includes success or failure, modality, device ID, location, operator, and detailed error codes. This is the foundation upon which all observability rests.
- Establish benchmarks: The authorities should define acceptable failure rate thresholds and monitor continuously against them. The benchmarks will create accountability.
- Build escalation workflows: The authorities should connect dashboard signals to predefined response pathways. The threshold breaches will trigger investigation, persistent patterns will trigger audits, and regional spikes will trigger field support. Visibility by itself, without action pathways, is incomplete.
- Assign institutional ownership: Determine who monitors which signals, who owns which failure categories, and who has the authority to intervene. Observability requires governance, not just technology.
These dashboards show that transaction-level visibility is a prerequisite for individuals to exercise their digital identity. For governments, this translates into reduced leakage in welfare delivery, lower grievance redressal costs, and evidence to justify infrastructure investments. For regulators, it enables continuous oversight rather than episodic audits, with the ability to detect exclusion patterns before they become systemic failures. For service providers, operations shift from reactive fixes to early intervention, which reduces reputational risk and improves user retention. For citizens, particularly the most vulnerable, it means fewer failed attempts at ration shops and benefit disbursements.
Dashboards integrated with the transaction-level observability framework become decision-support systems that close the loop between system performance, governance response, and public trust. When authentication works, people trust the system. When it fails visibly and accountably, it can be fixed. That is the foundation of digital inclusion.
Written by

Rahul Gupta
Assistant Manager
Mohak Srivastava
Manager
Swastik Das
Senior Manager
Leave comments