Data segmentation to understand your audience better
 by Aakash Mehrotra and Chinmay Dabhade
 Nov 25, 2022
 4 min
4 min
MSC strives to design better products and processes for our clients and evaluate the social value they create. Yet we cannot afford to consider the entire customer base of our clients as a single entity. MSC uses customer segmentation to account for nuances and differences in human behavior. We have worked with different clients to help them understand their customer’s banking needs, financial behavior, and creditworthiness. This blog presents our experience and lessons from our customer segmentation work to address clients’ needs.
Good causes need great designs and greater details. Funders, donors, and the general public want to know more about the social value created by projects. MSC has experience in both ends of the spectrum. We worked with donors and institutions to design better products or processes and evaluate the social value created by the products or processes for end users.
Yet, one constant aspect across these products and processes is not every user uses or acts the intended way. Acquiring this understanding made us the early advocates of customer-centered design. We found segments within the population worth studying and saw an opportunity to delve into the complexities of data to identify unique segments.
The segmentation MSC uses
MSC is among the early adopters of statistical techniques to understand the study population better. We base our recommendations on insights generated from data.
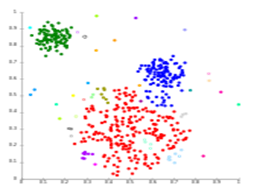
For instance, MSC conducted a study with fisherfolks to understand their financial behavior and management. The figure 1 shows three segments within the fisherfolk data, based on socio-demographic indicators, such as age, education, and income. The graph has three segments—red, green, and blue clusters—that were tested across different variables to understand their differences. Further, the graph shows groups with similar characteristics using cluster analysis.
Figure 1: Distribution of fisherfolk in three clusters
The figures 2 and 3 depict the investment made by fisherfolk in past year and number of cases of default by fisherfolk in each cluster. It shows how we used the segmentation approach to understand each segment’s investment pattern, credit behavior, and rate of defaulting on loans to develop a credit assessment framework.
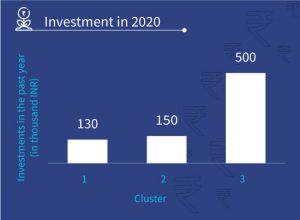
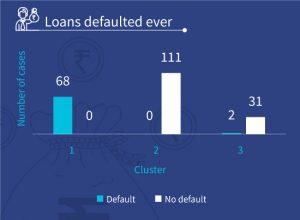
Figure 2: Investments made by fisherfolk in 2020 Figure 3: Loans ever defaulted by fisherfolk
We conducted a similar exercise with the users of small finance banks (SFB) to understand the banking needs and financial behavior of different customer segments. Segmentation allowed us to design a better and more customized range of financial products for the banks’ LMI customer segment.
We conducted another exercise with a FinTech partner that offers digital credit to small merchants. We categorized creditworthy customers as “good” and customers with high defaults as “bad.” We followed up the segmentation exercise with predictive modeling using a decision tree approach, as shown in the figure. It helped us predict the customers’ patterns of defaulting and provide insights on indicators, such as likely geographical areas and groups of merchants with high defaults. Such analyses help businesses minimize risks greatly and adopt an agile customer approach.
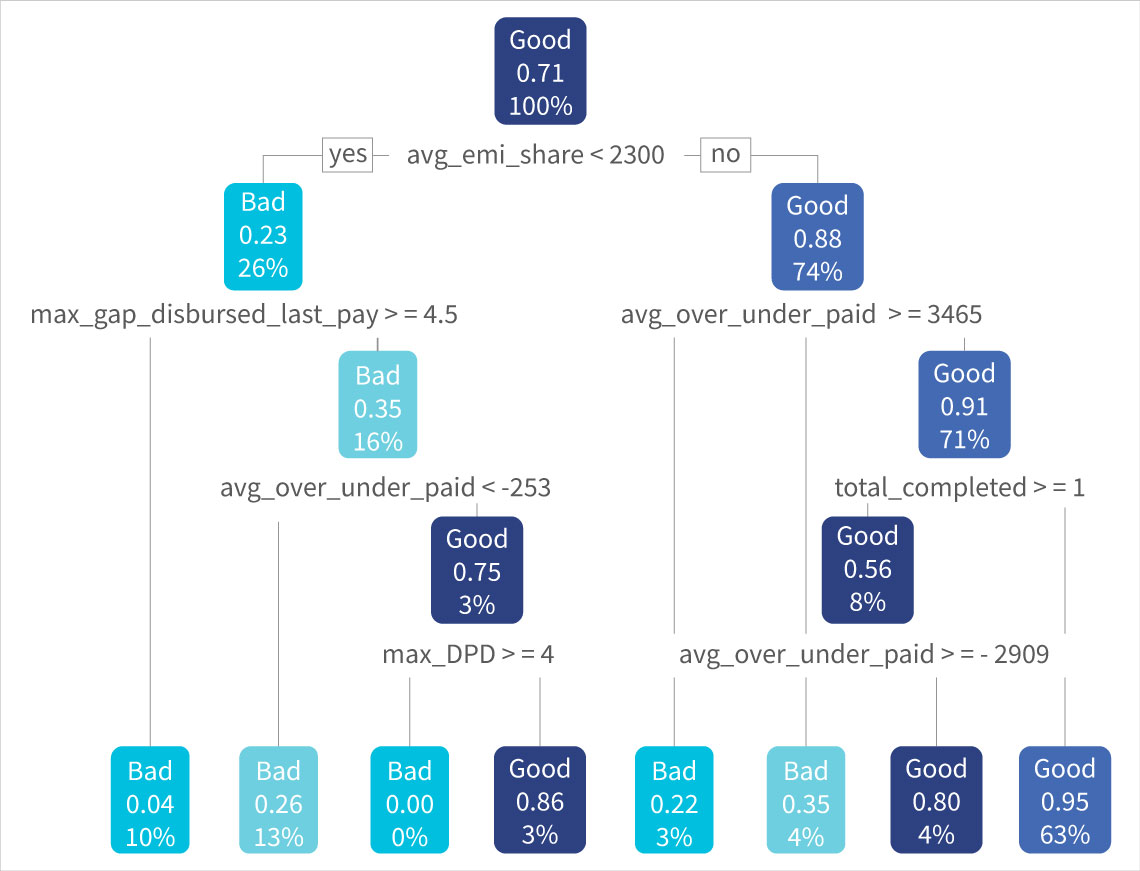
Figure 4
Frontier Markets focuses on rural e-commerce. So, we conducted a similar segmentation exercise to identify their good and bad customers based on the customers’ buying preferences. Further, the segments helped us conduct anassociation analysis, make recommendations to the firm on product bundling, and provide customized marketing suggestions to its customers.
An approach to the segmentation exercise
MSC’s segmentation exercises are typically done in four steps, each adding a layer to the analysis required.
1. Variable selection phase: In the first step, we try to understand the purpose and need of the segmentation exercise. Understanding this helps chalk out the method or process to be followed to create segments from the available dataset. For instance, if we wish to know about a product’s uptake or usage, our variables of interest will be behavioral data or anything that affects that behavior, such as socio-demographics, income, or other variables.
2. Data collection and dataset development phase: Before collecting the data, we must identify customer characteristics. Once we have identified these characteristics, we can prepare a data collection plan that details where we can find each variable and the method to collect data. After data collection is over, we validate and process it, addressing outliers where needed. The data may often require creating variables from existing variables or converting numeric data to categorical data for better analysis.
3. Segmentation phase: After preparing the data for analysis, we must choose a model using machine learning techniques to conduct the segmentation exercise. The segmentation approach requires unsupervised techniques as no response variable is measured here. For example, when we predict loan defaulters the response variable is whether a person has defaulted on a loan in the past. Here, we wanted to group people with similar credit risk. Thus, no variable can be measured to compute similarity between credit behavior in a group of people.
Cluster analysis is the most popular algorithm used for segmentation. Creating rules manually to group observations together is challenging for datasets with a large number of variables. We need an algorithm to create these rules to segregate observations into homogenous groups accurately and efficiently. The cluster definitions change when we provide new data to the algorithm, which ensures that segments always reflect the current state of the data.
4. Data interpretation and modeling phase: The last step of the analysis is to find or define the characteristics of each segment obtained. We calculate averages of all data features for each cluster and use them to prepare cluster profiles to gain insights into our different segments.
However, segmentation may not help in all the scenarios. The insights generated from data can be unreliable if the sample size is not sufficiently large. Data can also lack any natural groups even though they may be present in the population. Incorrect responses, especially to ranking or Likert scale questions, can introduce bias in the data.
However, despite its limits, segmentation remains a powerful tool to find and analyze the diverse groups in a population. It enables policymakers, donors, and implementing agencies to understand and meet the needs of specific groups more effectively. In the ever-growing data economy, using tools like segmentation to understand our audience better and develop more customized and meaningful solutions.
Written by


Leave comments