Lenders, insurers, and agricultural businesses in the same country each pay to build similar AI foundations. Building the shared parts once would help them serve smallholder farmers and small businesses better and at lower cost, while each retains control of its clients, data, and decisions.
Take Malti, a vegetable seller in a market town in India. She needs a small loan to buy stock before the busy season. She keeps her accounts in a notebook, is paid mostly in cash, and speaks a language her lender’s systems cannot read. Field visits to serve her add costs that the interest on her loan cannot cover, so she is turned down or is offered credit on tougher terms.
A dairy farmer in Kenya, a coffee grower in Colombia, and a sari-sari store owner in the Philippines face the same barrier. Artificial intelligence (AI) can lower it by reading a handwritten ledger from a photo, answering in local languages, and giving the lender a clearer view of risk. Doing this well takes four kinds of AI working together, and no single supplier offers all four. We propose building that foundation once, as an open commons, and seek partners to fund it.
AI can help clients run, buy, and sell better.
Only 56% of adults in low- and middle-income countries can raise emergency funds within 30 days, as per the Global Findex 2025, and small businesses in emerging markets face a USD 5.7 trillion credit gap (SME Finance Forum and IFC, 2019 estimate). Beyond the loan decision, AI can help these businesses run better, buy better, and sell better by finding cheaper suppliers, a government incentive they qualify for, and new buyers. The test of every tool is whether the client’s financial health, income, and resilience improve.
A provider needs four AI capabilities at the same time.
Four capabilities must work together to serve Malti’s well and cost-effectively.
- General reasoning, for informed decisions: The client gets coaching on running her business, and clear answers to her questions. The provider’s staff process applications and get answers in seconds.
- Local language and documents, to overcome language barriers: The client gets advice in her own language, by text or by voice, even on a basic phone with a weak signal. The provider reads a handwritten form without retyping it.
- Domain analysis, for practical insights: Smaller, domain-specific models analyze supply chains, market prices, or rainfall and soil. The client learns what to plant, and when and where to sell. The provider sees risk more clearly.
- Traceable decisions, for transparency and accountability: The client gets a reason she can understand, and a way to challenge a decision she thinks is wrong. The provider keeps a record that its supervisor can audit.
No single supplier offers all four. The strongest reasoning tools are rented from global companies, run outside most of these countries, and work best in English. Local language tools are improving, with regional efforts, such as Sarvam in India, SEA-LION across Southeast Asia, and Latam-GPT from Chile. Yet, as MSC’s fieldwork shows, reading handwriting in a local script or answering by voice in most African languages is not yet reliable. Domain-specific models or “small AI” models built for a particular purpose need local data. Traceable decisions require the provider to retain the evidence, rules, and model versions behind a decision, so a client or regulator can understand how it was reached.
Few providers have the staff to run and maintain these systems internally.
One trusted layer allows a provider to mix suppliers and keep control.
Our design places an AI Routing and Control layer between the provider and every AI system it uses, and each provider runs its own. Think of it as a switchboard with a rulebook. Every call from staff, systems, and applications passes through it, as does every request from a phone that the device cannot handle. For each request, the layer decides two things: What the AI system may see, and what it may do.
When a model needs context, such as a client’s record, the provider’s credit policy, or a scanned form, the layer retrieves it under the provider’s permissions. Identified client data goes only to models running in the country, and identifiers are removed before anything goes abroad. When a model needs to act, such as checking a balance or pulling a bureau score, it does so through the layer, never directly. The provider writes the rules in terms its supervisor can read, and the layer logs every question, answer, and action.
Models used for business decisions, such as credit scoring, stay inside the provider’s environment and feed its own decision engines. On the phones of agents and clients, the work runs on the device where it can, even offline, as MSC’s x-VOX platform already does. Only what the device cannot do reaches the layer.
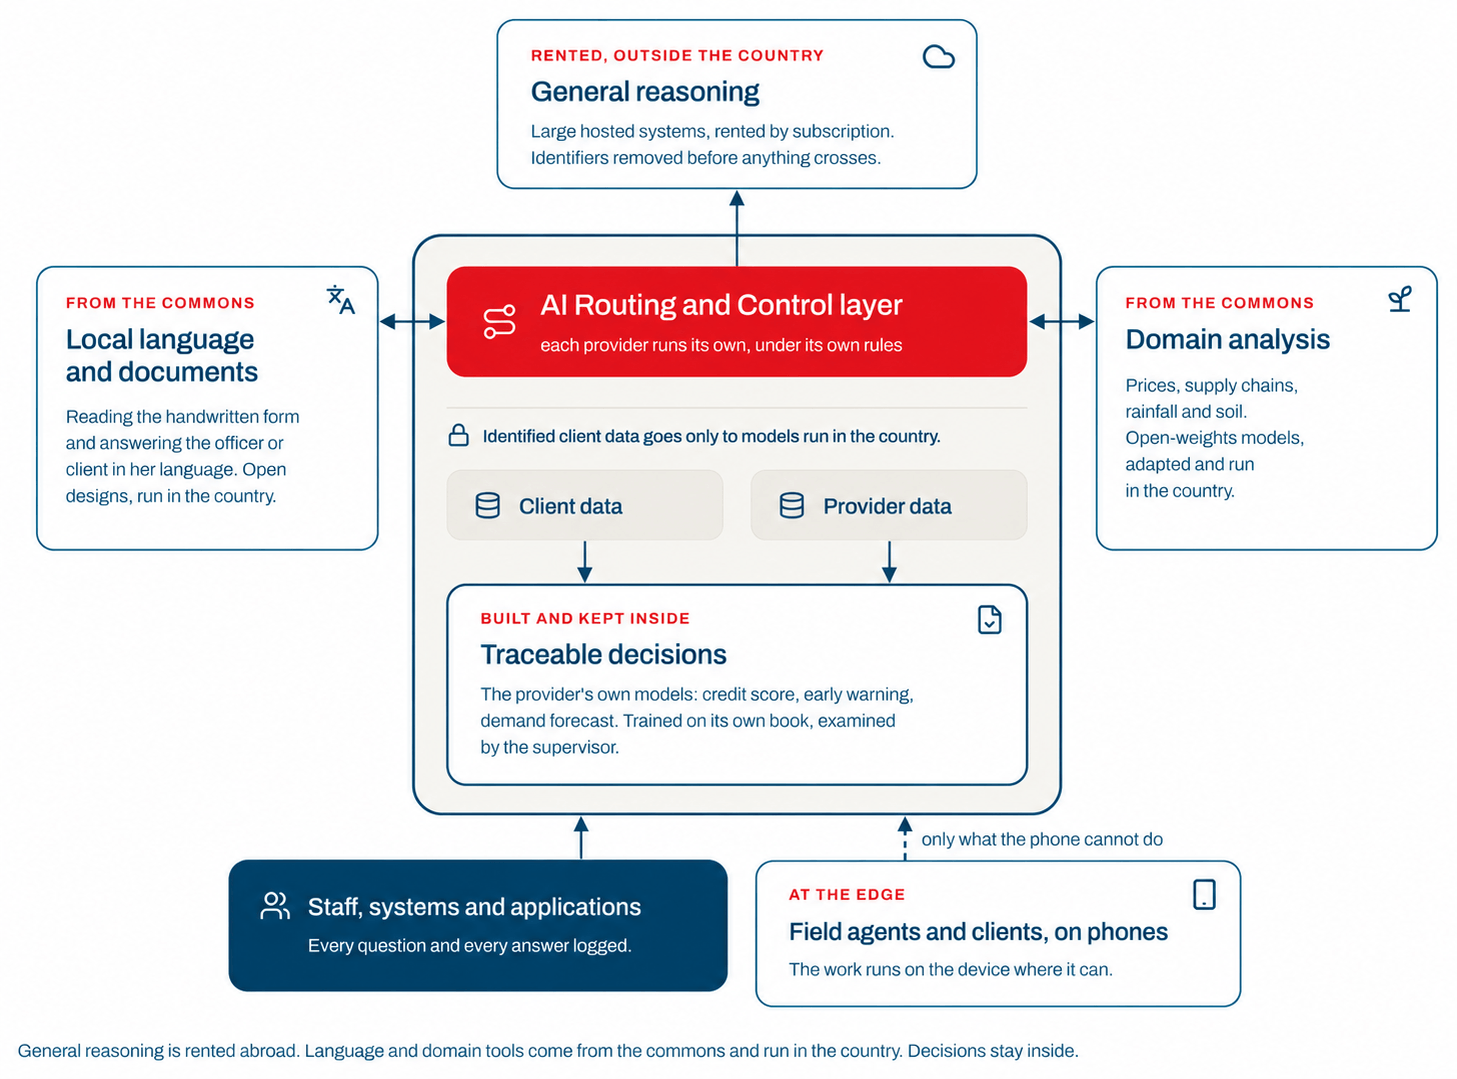
Because every call passes through one place, the provider can change suppliers as technology, prices, and regulations change, as long as the new system’s license allows commercial use, which some open models, such as InkubaLM, do not. While building this design is one thing, running it is where many providers will struggle.
Build the shared parts once.
Take 12 financial service providers in one country. They share a supervisor, an identity system, a payment network, and a set of languages, yet each builds the same connections, language tools, and tests alone. Each still funds what it competes on from its own balance sheet, and without peer evidence of a return, most boards wait. Little outside capital fills the gap. As of September 2026, financial inclusion and agriculture received USD 445 million across 12 countries, of the USD 90 billion in AI capital tracked by the Accendo Capital Flows Map in emerging markets. That is half a cent in every dollar, and nearly all of it went to single firms.
We propose building an open commons, held by a nonprofit, which publishes three things: An open design for the layer, local-language tools, and domain-specific models with open weights that anyone can inspect. Each provider implements them locally on its own systems, under its own rules, and adapts them to its own market. Providers gain lower costs, peer results before they commit, and common standards that let them change vendors, while each remains accountable to its supervisor.
Grants would build the commons, and member fees would maintain it. We seek funding partners who back shared infrastructure, and want to hear from providers, vendors, and supervisors who see the problem differently.
Malti the vegetable seller will never see the AI Routing & Control layer. She will see a lender who can read her notebook, answer her in her own language, and offer terms that work for her business. A shared foundation makes that affordable for every provider in her country.
This is the first of four parts. Part two goes deeper into the architecture: The walled, gated garden that sets what a provider owns and what it rents, how the layer works on devices, and how the commons is governed and funded. Part three looks at the risks, including shared models that fail together, and how the design answers them. Part four sets out named asks to funders, supervisors, and providers, and a first group of providers in one country.
This blog is part one of a four-part series by Accendo Associates and MSC (MicroSave Consulting).
More to come.