The study on Business Correspondent Models in Bihar- Constraints and Way Forward was commissioned by DFID’s PSIG Programme and SIDBI to improve the current body of knowledge around the status of the BC model in Bihar, to provide recommendations to improve the effectiveness of the model and to offer inputs to policymakers.
Blog
Key New Year Resolutions for the Success of Digital Financial Services


First of all, let me reaffirm my belief that digital financial services (DFS) really do have the potential to provide financial inclusion for many (but perhaps not all) of the 2 billion un-banked. Its potential to reduce the costs of providing a range of financial services is an exciting prospect for those of us who have long critiqued the monoculture of microcredit. And the potential of DFS is already being hinted at in recent studies – most recent, “The Long-run Poverty and Gender Impacts of Mobile Money” by Tavneet Suri and William Jack, is particularly encouraging:
“We estimate that access to the Kenyan mobile money system M-PESA increased per capita consumption levels and lifted 194,000 households, or 2% of Kenyan households, out of poverty. The impacts, which are more pronounced for female-headed households, appear to be driven by changes in financial behavior—in particular, increased financial resilience and saving—and labor market outcomes, such as occupational choice, especially for women, who moved out of agriculture and into business.” – Tavneet Suri and William Jack
However, DFS is currently facing two big challenges that have the potential to undermine all the progress made to date:
1. Digital Credit
Access to small amounts of credit with a few key strokes can be immensely important and valuable for people facing short-term cash-flow problems or emergencies. So digital credit meets important demand – as the enormous uptake of such products in East Africa have demonstrated. But it does carry important risks for consumers and the industry as a whole.
With a few honourable exceptions, notably Equitel’s Eazzy Plus loan (which draws on Equity Bank’s customer transaction data) and the KCB-M-PESA loan, most digital credit products currently on offer bear all the hallmarks of consumer or pay-day lending. Their annualised percentage interest rates contain high risk premiums. This is understandable in that, for all the hype, low-income people leave very shallow digital footprints because of their limited use of mobiles – for calls, messages, or sending money. But few digital credit providers reduce interest rates for those customers who do build up deep digital footprints through high levels of activity on the network and/or regular on-time payment their loans. Instead, they are rewarded with offers of higher loan amounts at the same, risk premium-inflated, interest rates.
For the leading players at least, these interest rates do compare (sometimes even favourably) with the 10% per month interest rates typically charged by the informal sector lenders in East Africa. But I am not sure that this is the right benchmark to which we should aspire.
CGAP and others have also been raising important questions around customer protection measures as well as the opaque terms and conditions surrounding digital credit. The Competition Authority of Kenya (CAK) has taken important steps to ensure that: (1) borrowers are presented with key elements of the terms and conditions as part of the process of accessing their loan on their mobiles; and (2) lenders provide both negative and positive reports to the reference bureaus active in the country.
Nonetheless, the growing numbers of clients blacklisted for outstanding loans of >90 days on the credit bureaus is a matter for profound concern. After alarming newspaper articles on this, MicroSave called the leading credit bureau in Kenya and was told that the reports were correct. The bureau has about 10.6 million listings for digital credit borrowers, out of which about 2.7 million are negative. We do not have the full data set to corroborate these numbers, but there seems little reason to doubt them, given their source.
This would suggest that digital credit has already resulted in the effective financial exclusion of 2.7 million people in Kenya. And that, if this trend persists, providers of digital credit will soon run out of borrowers.
It is intriguing to speculate as to why so many people should fail to repay their typically small digital credit loans. Part of the problem may lie in borrowers’ lack of ability to pay, and part in lack of understanding (despite the efforts to clarify terms and conditions and use of SMS reminders to encourage people to repay on time) … but I would suggest that an important part lies in the ease of accessing these loans. And that some digital credit providers actually push these loans at potential borrowers.
I wonder if providers (or CAK) need to encourage user-defined friction to address these latter problems, in an attempt to avoid the ill-considered, non-essential loans that are taken out, particularly in bars on Friday and Saturday evenings. Users could, as part of the initial registration process, define additional criteria such as the credit being only available after a day’s cooling off period (during which the application could be cancelled). To provide for emergencies, when the one-day cooling off period could present a real problem, a user-defined, second PIN could be added to override this provision. To be effective, this type of product engineering must be developed through careful research into consumers’ needs, perceptions, aspirations and behaviour – as outlined in The Helix’s training on Product Innovation and Development.
We need to understand the consumer experience and what behavioural levers might be used to nudge them towards better self-protection much better than we currently do. In addition, as AFI and CGAP have already flagged, additional regulation and oversight is needed, given the burgeoning of digital credit and the challenges it presents to regulators. It was, therefore, excellent to see the ITU working group on Consumer Protection in DFS make such a robust set of recommendations.
2. The Trust Deficit
DFS depend on customers’ trust in the systems and agents used to deliver the service even more than in traditional financial services. Protecting the customer and minimising the risks as he/she uses the service is essential to build and maintain that trust. And yet, in most of the 20 markets where MicroSave has worked on DFS, a combination of service/system downtime, agent illiquidity and churn, complex USSD/SMS-based user interfaces, and poor customer recourse means that there is limited trust in DFS. As a result, many users prefer to perform over-the-counter (OTC) transactions rather than take the risk of keeping money in their wallets or sending it to the wrong recipient. We often hear that financial education or marketing will overcome these barriers – but I suspect that this belief is over-optimistic.
Many of these issues require providers to invest more in their platforms and agent networks in order to build a comprehensive and thus profitable digital ecosystem, beyond an OTC-based and payments-dominated one. This is a “hygiene factor” pre-requisite for transforming DFS into real financial inclusion and rolling out a range of services.
Smart phones may provide the key to realising the full potential of DFS ecosystems. Smart phones allow us to build interfaces that are much more intuitive for the end-user, and to reflect the mental models that poor people use to manage their money.
Zooming out to see the big picture
Ultimately we need an over-arching strategy to address the two inter-related challenges of trust and digital credit. We need to encourage low-income people to maintain and use digital liquidity, thus deepening their digital footprints and allowing digital credit providers to reduce their interest rates. G2P and other bulk payments will be key to creating digital liquidity – some important work is underway on this already. Digitising a wide variety of value chains and procurement/distribution platforms as well as retail merchant acceptance ecosystems will also be essential to keeping money digital and circulating it.
But the success of these efforts will depend on addressing the hygiene factors that currently undermine trust in digital financial services. Only this will lead to a trusted, convenient and efficient digital ecosystem, with increased volumes, reduced costs, increased providers’ profitability and, ultimately, deeper digital footprints to inform digital lending operations.
Is digital credit a silver bullet?

Digital credit loans, accessed and repaid through mobile phones, have proved enormously popular since M-Shwari was first launched in 2012. There is a remarkable demand for both SME and small consumer loans. They are clearly offering a valuable and important service for the mass market. However, there are growing questions about the design of the consumer lending products and the unanticipated effects arising from them. Providers will need to address these if they are to realise the full potential of digital credit. This presentation was made by Graham A.N. Wright, Director MicroSave at a webinar conducted by The DFS Observatory at Columbia University. In his presentation, Graham Wright highlighted evidence from Kenya, Uganda & India.
Smart Electronic Ticketing for Public Transport
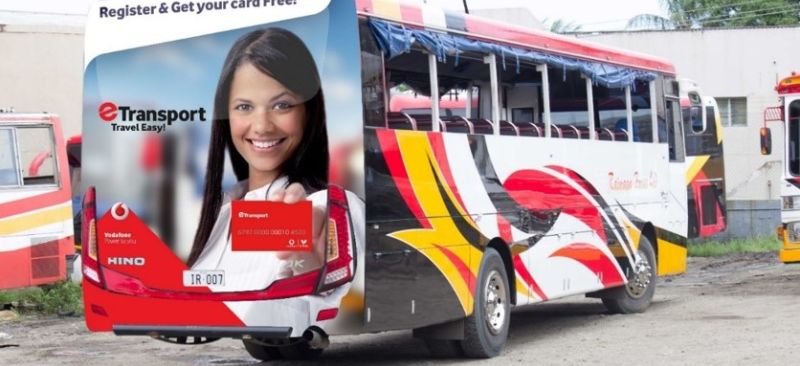

We met Kinnee at one of the Vodafone e-ticketing roadshows. She, like other Fijians, had queued up at the Vodafone canopy to get her eTransport card. This digital card has been designed to replace the existing cash-based fare collection system across buses in Fiji. There was something that made Kinnee’s case particularly interesting – she had always been apprehensive about digital payments and had never used it before. However, the Fijian Government’s ruling to digitise public transit left Kinnee without a choice. We decided to follow her on her new journey. She emerged from the crowd, ecstatic, with her latest possession – a brand new, bright red eTransport card. Kinnee had just begun her digital journey and was excited. As were we.
A month later, after riding the bus thrice with her new eTransport card, Kinnee was amazed at the convenience that the new payment system had brought in her life. Not only was she excited about the experience of ‘tapping’ the card on the bus, but was also relieved from the hassle of carrying coins and haggling for change. She mentioned that a greater respite would be when her eight-year-old son starts using the card on his school bus. She quipped that now she would be able to outsmart her child by monitoring his expenses.
This anecdote highlights the transformative experiences that thousands of Fijians will undergo in the days to come. Public transport is vital for the people of this Pacific island-nation. Over 1,470 buses, as well as hundreds of boats and taxis, carry a significant percentage of the 920,000+ Fijians each year. Nearly 210,000 school and college students, and over 50,000 senior citizens are heavily dependent on public transport in the country. The Land Transport Authority, under the Ministry of Infrastructure and Transport, provides various concessions and grants for commuter convenience. Public bus transport is licensed to 54 private companies, covering 188 main Road Route Licenses (RRLs). All students and the elderly are eligible for discounted fares on buses. Almost 61,000 of them are eligible for 100% discount and do not pay any fare. The Ministry of Education issues discounted bus fare vouchers to eligible students under the government fare subsidy scheme for needy children. These vouchers are distributed individually through schools.
Private bus operators are eligible for a refund on fuel tariff and receive customs concessions to encourage fleet renewal. The Fijian government has introduced such measures to compensate private operators for losses from these concessional fares. In the national budget of Fiji for 2017–2018, the import duty on new buses has been reduced to zero for a period of two years, with certain conditions. Bus operators are also exempted from paying Value-Added-Taxes (VAT). These grants and concessions add up to several million dollars a year.
Despite the massive financial support from the government, the current bus ticketing system faces several challenges. Several routes are claimed to be unprofitable, with bus operators alleging that they face severe losses. According to a report, bus operators on 22 routes cited annual losses of USD 4 million. In contrast, there seems to be a lack of accountability and diligence on part of the drivers. The distribution of millions of discounted vouchers to students every year in paper form places a significant additional burden on the school staff, requiring accurate accounting, distribution, and reconciliation. It is also vulnerable to misuse, despite check and balances being in place.
To overcome such challenges, the Government of Fiji plans to implement electronic ticketing in phases for public transport in Fiji. The move towards electronic ticketing is aimed to provide greater convenience and a superior user experience to commuters. At the initial stage, e-ticketing has been implemented for all buses plying on the mainland routes across Fiji. Rural service vehicles plying on the deeper rural routes are likely to be covered in subsequent phases. With the gradual transition away from cash, which started in July 2017, all mainland buses are slated to go cashless from October 2017 onwards.
The eTransport project involves multiple stakeholders on board, who would participate and collaborate in the development or adoption of the system. The main stakeholders of this project are:
- The Government of Fiji;
- The Land Transport Authority;
- The Ministry of Education;
- The Department of Social Welfare (Ministry of Women, Children and Poverty Alleviation);
- The Ministry of Economy;
- The Fiji Bus Operators’ Association and other bus operators in Fiji;
- Vodafone Fiji;
- Pacific Financial Inclusion Programme (PFIP).
The advantages of an electronic ticketing system will be:
- Improved revenue collection and cash flows for the bus operators and the government;
- ·Greater transparency and control over targeting, coverage, and distribution of the transport assistance/subsidy to the students, pensioners, senior citizens, and disabled citizens/residents;
- No requirement for cash or change for passengers or drivers, resulting in speedy transactions;
- Reduction in the handling of cash and associated efforts and risks;
- Richer data and information quality for the government ministries and departments, and bus operators – for improved revenue management and informed decision-making;
- Opportunities to learn lessons and build future capabilities to expand the e-ticketing architecture and platform to e-commerce, digital G2P and P2G payments, electronic attendance for students/teachers in schools, and other relevant use-cases.
The Design
PFIP and MicroSave consultants collaborated with and supported Vodafone in the design, planning, and rollout of the e-ticketing service. The service was branded as eTransport. The objective was to take advantage of global experience and lessons learned to avoid potential pitfalls, and to ensure improved service design and user experience. PFIP and MicroSave have developed several tools and frameworks to support Vodafone’s eTransport service.
An important element of PFIP’s approach has been to focus on and ensure consumer-centricity, particularly for women. Keeping this in view, we developed and mapped the complete lifecycle journeys of various user segments for the e-ticketing service in a framework. These user segments comprise adults, women, students, senior citizens, and concessional card users. The mapping process has formed the basis for defining or refining business requirements and business rules to be followed, as presented below. Moreover, this significantly aids in modifications to existing information technology (IT) systems and processes at Vodafone.

Deliberations based on this framework led to an improvement of several service functionalities and processes to enhance user experience. These improvements led to features, such as the ability to remotely top-up, or load e-money, to another person’s card using the M-PAiSA mobile wallet on a phone, or top-ups using only the serial number of a card without it being physically present. Other features that evolved from this approach include the ability for customers to refresh the stored value of their card while travelling in the buses, and to pay the fare immediately thereafter. Such features will eventually be of great utility to users. They would have access to multiple, remote options to recharge their eTransport cards, and would not have to depend on physical touch-points to do so. Vodafone would introduce these user interface functionalities in a phased approach, given the timelines for system development required.
Another example relates to concessional student eTransport cards, which need to be refreshed at the beginning of every school term once Vodafone has loaded the subsidy amounts onto the cards. The loading of subsidies is done through Vodafone’s back-end systems, on advice from the Ministry of Education. We suggested providing one or more POS devices at the school premises. The existing staff who handle paper vouchers would use the POS devices to refresh the student cards. This would add to the convenience of students, including the much younger primary school children. We developed a solution to cover the device costs when Vodafone agreed to provide a substantial discount on the cost of devices to be deployed in schools. The Ministry of Education is likely to consider these recommendations, which will ensure a near-seamless transition to the new system for the nearly 210,000 students in Fiji, without inconvenience or worries. Likewise, improvements have been made to the processes related to cards for senior citizens and the disabled, which are managed by the Department of Social Welfare.
There are several other learnings and smart-features associated with the architecture of the e-ticketing system in Fiji. The first major one is to ensure a commitment from the bus operators and drivers themselves. A lack of this has been the failing of some models in other markets. The Government of Fiji has ensured participation and commitment of the bus operators both through funding support and policy reforms. Considerable financial and handholding support has been provided in this regard. The financial support is in the form of subsidies on equipment required on buses. The handholding support is in terms of retrofitting/testing of equipment and software, training and capacity-building of the bus operators and drivers, and customer care support offered by Vodafone, among others.
Furthermore, the eTransport solution has been designed with an offline architecture, which does not depend on the availability or operation of the Vodafone mobile network. This will ensure that fare payment on buses is possible offline and in locations where or in situations when Vodafone’s network is unavailable. At the same time, information will be shared periodically between the devices on the buses and Vodafone M-PAiSA and other back-end systems through the mobile network whenever available during transit. This will allow synchronisation of the bus-based devices with Vodafone’s systems to enable balance-refresh on consumer cards during transit. The synchronisation would also allow the reconciliation of daily sales by the bus operators, and so on.
These considerations for an enhanced human-centric design architecture and superior user experience are in stark contrast to some of the less successful e-ticketing models in East Africa, which proved troublesome for users.
The eTransport card initiative has been a collaborative effort that spans stakeholders and vendors. Its end-outcome is the timely rollout of the service within three or four months, covering over 1,000 buses. The initiative includes the development of back-end integrated systems, training of agents and merchants on the new service, marketing programme design, and roadshows and awareness campaigns. Once operational, the eTransport project will see user registration and card issuance to over 520,000 commuters across Fiji.
The blog was first published by the Pacific Financial Inclusion Programme (PFIP).
Can Fintech Really Deliver On Its Promise For Financial Inclusion?

At the recent MasterCard Foundation Symposium on Financial Inclusion, I was asked to participate in the closing debate. A great honour. However, I was asked to support the proposition that “Disruptive innovations in the financial sector can no longer respond to the daily challenges of poor people”. Ouch! For all my critiques of digital financial services and digital credit, arguing this side of the debate is a real challenge. Especially when the potential for innovation and fintech to revolutionise our ability to deliver financial inclusion is so very clear.
MicroSave recognises this potential and has been working closely on a variety of initiatives that support fintechs and incubation labs. We are seeing a large number of extraordinary developments, tools, and solutions that can have a major beneficial impact on the lives of the poor. So arguing that fintech is unable and unlikely to respond to the needs of the poor was a tough ask …
I love fintech. I use fintech every day. I am a fintech fan … but I am privileged and middle class – and so both educated and connected.
However, if we visit a typical rural village in a developing country, we would see that the situation is very different. Fintech, in its current form, may be largely irrelevant. Why so?
- In most rural villages there is inadequate infrastructure to support fintech. In these markets, fintech faces some basic challenges. This is leaving aside the challenges concerning the business-case and liquidity management for rural agents, which remain very real and persistent problems. In many villages, there is limited or no electricity, which makes powering phones or towers difficult. Many villages have no signal to support mobile telephony. In places that do have a signal, it is typically 2G and thus does not support most fintech services, which require 3G or above to function properly.
- Among poor households, there are few smartphones, and even the feature phones are owned by the men. This leaves women with limited or no access. A recent Mozilla report highlighted that low-end smartphones have very limited RAM, which prohibits running many fintech apps. In addition, they also typically have hopelessly short battery life, screens that shatter easily, and a persistent problem with ‘fat finger error’ that makes them almost unusable. These are the very devices that are expected to lead the charge of achieving mass smartphone penetration amongst the poor. Furthermore, the cost of data needed to make fintech transactions is usually prohibitively expensive. Indeed, in our fieldwork, we have seen some men in Africa proudly carrying prestigious smartphones but using them only to make or receive calls and SMSs
According to the World’s Women Report 2015, there are 781 million illiterate people on the planet. The underlying assumption that those that pass Standard V are literate and numerate is fundamentally flawed. These estimates, therefore, significantly understate the size of the problem – perhaps by as much as 100%. In India, for example, “Half of all children in Std V have not yet learned basic skills that they should have learned by Std II.” (Pratham, ASER 2014).
3. Furthermore, most villagers are ‘Oral’. They – along with another 1 billion-plus people across the planet – cannot read, write, or understand the long number strings necessary to transact on mobile phones. This has profound implications for their ability to use digital financial services. Indeed, asking them to move away from counting cash to digital interfaces will remove a key learning opportunity and strand them in a literate environment that they do not comprehend.
4. Fintech is irrelevant for most villagers because providers have made little effort to tailor interfaces or use-cases for the low-income market. The vast majority of fintech providers develop solutions for the affluent and middle classes. This makes logical sense – these segments have the money (and connectivity) to use the solutions. Furthermore, fintech developers typically come from this background. They, therefore, understand the challenges this segment faces and thus the opportunities it provides. In contrast, when and if fintech developers focus on the low-income segments, they tend to create solutions and then look for problems to solve in preference to understanding the needs, aspirations, perceptions and behaviour of the poor first.
5. Furthermore, villagers value personal relationships – particularly when it comes to money. The idea of trusting technology that they do not understand for anything except very basic payments is out of the question. The idea of using a fintech solution on a mobile phone is alien and often even intimidating. This is particularly when the majority of systems they have seen or heard about remain unreliable and offer limited customer support and recourse.
6. Finally, it is quite clear that till date, the regulatory environment and consumer protection provisions remain too weak to secure the poor. Many have already lost money in basic money transfer transactions. Millions are negatively listed on credit bureauxand in the databases of large banks because of digital credit. Furthermore, in the flagship M-PESA deployment, almost half of non-airtime top-up transactions are for gambling … With a track record like this, how can we honestly claim that technology is helping the poor?
Perhaps it is time to take a step back and to reflect beyond the hype. Until we address these six fundamental barriers to the deployment and use of fintech by the poor, it will indeed remain irrelevant to them. In fact, we risk exacerbating the digital divide and leaving the poor and vulnerable behind.
The most basic innovation at the heart of digital financial services is mobile money. Yet GSMA’s State of the Industry Report 2016 tells us that just 12% of the 286 deployments have more than 1 million active users. With such shaky foundations, it is clear that we have a long way to go before fintech can deliver on its promise of bringing services that are accessible and valuable, and thus can provide financial inclusion for the poor.
The Missing Truth on the Agent Banking Business Case in Nigeria

Agent banking is increasingly popular in many developing countries. From Brazil to Kenya and many other emerging markets, agent banking has increased the use of transactional financial services among financially excluded adults. In Nigeria, the Central Bank introduced agent banking guidelines in 2013 to contribute towards achieving the objectives of the National Financial Inclusion Strategy. According to the EFInA 2016 Financial Access Survey, only 38.3% of the adult population in the country has access to formal financial services. This is characterised as having access to deposit money banks, microfinance banks, mobile money, insurance and/or pensions.
Since 2013, and increasingly through 2017, leading banks have embarked on a revolution in agent banking. These deposit money banks believe agent banking would enable them to reach more customers with increased profitability through better efficiency and cost-reduction. In the case of agents, the revolution is expected to ensure financial remuneration, increased customer traffic to pre-existing businesses of the agents, and improved community status through bank brand affiliation. For customers, the expected benefits are convenience and cheaper transaction costs. While this understanding of bankers is indeed appropriate – they often fail to consider critical elements of agent banking. Some of these misunderstandings are as follows:
Lack of Appreciation that Agent Banking is an Evolution
Agent banking plays an important part in the evolution of digital financial services. It is a critical step in the movement towards user-initiated transactions. Agent banking requires strategies that appreciate the element of time, therefore, the objectives and benefits need to be split into the short-run and medium-term. In the short-run, agent banking should mainly be perceived as an additional channel for the provision of products and services beyond the existing branch channels. Existing banks currently have only transactional relationships with customers from the bottom of the pyramid and not true banking relationships. This is partly attributed to existing products not being fashioned for the lower-income segments.
Having a network of agents does not guarantee the attraction of customers. It calls for developing products that target customers consider useful. These are products that can address their daily money management pain-points. The network cannot be expected to be the main driver for customer acquisition without considering the prevailing challenges around the creation of Biometric Verification Number (BVN), which constrain the ability of the banks to on-board new customers. Until these challenges are resolved, banks would need to migrate their existing lower value transactions from branches to agents to reinforce the business-case of agents.
In the medium-term, the case for agent banking is about providing value-added services. This involves the development of products that enable customers to easily associate and build relationships with a bank through increased transactions, which is necessary for market penetration. As an objective of financial inclusion, the focus should be on making financial services relevant to the unbanked on a daily basis. This would call for two critical steps. The first step is to build low cost ‘bridges’ to cash, that is, in the form of a ubiquitous, well-supported agent network. This would allow Nigerians to easily convert cash into electronic value (e-value). The second step is to make the e-value directly useful for customers, to encourage them to maintain their money in this form. Banks should, therefore, identify compelling use-cases and tap into relevant opportunities that exist in Nigeria.
Distended Expectations on Agent Banking Profitability
Agent banking is fundamentally not about the banks making huge direct profits through a low-cost channel. It is about what the additional channels can do to change the business model over time, shifting the banks’ customers from using more expensive channels like branches, service centres and ATMs. The channel itself may not generate significant profits. It can, however, facilitate additional business for the bank, as well as additional deposits. Some institutions with exaggerated expectations intend to deploy huge agent networks at the start. This poses a challenge to adequately managing and supporting agents and/or eroding the expected benefits to agents. With this understanding, the institutions will not engage in ‘spray and pray’ agent acquisition strategies but progressively and strategically grow their networks region by region..
From high-profit expectations come inflated financial models, which then translate to unrealistic Key Performance Indicators (KPIs) for the operational or branch staff members. These KPIs are unrealistic due to the incorrect metrics that generate them. This leads to poor buy-in among the expected foot-soldiers as the KPIs would be deemed unrealistic. This understanding is critical to enable the senior management to prepare appropriate budgets and KPIs for the operational staff driving the business.
Fear of Co-opetition
Co-opetition is the ability of players to cooperate with each other for the benefit of each business while remaining competitors. It calls for close partnerships that leverage the comparative advantages of the partners. There is a fear of these partnerships by leading banks, which could slow down the prospects of agent banking. For instance, the various agent banking operations, network deployment, and product development are struggling. This is because of their nature of high-involvement, yet there is minimal individual bandwidth within the banks to effectively run the operations. This is coupled with ignorance of the fact that agent banking requires focus. Strategic partnerships within shared agent networks and close tie-ups with the FinTech players could transform the agent banking business-case in Nigeria. It would allow partners to play their roles on the basis of their core strength. FinTechs have been seen to even attract the more traditional banking customers with services tailored to their needs, while banks struggle to innovate. This is despite existing gaps in technology development and understanding in the market.
Conclusion
For agent banking to prosper in Nigeria there needs to be a deeper understanding of the true business-case. A better understanding of the business-case calls for top executive/management alignment, a paradigm shift in organisational culture and structure, and specific customer segment orientation and differentiation. The actual business-case needs to be clearly articulated to all stakeholders to ensure meaningful partnerships that would make things work. The uncomfortable truth that patience should be a virtue with this engagement is inevitable. It is for the banks to find a way to convince and address the no surulere mentality, meaning ‘no to patience’ for this business model to be effectively implemented, especially for the bank teams and agents.