
This demand-side diagnostic study aims to gauge the end-user experience in adopting cashless modes (including cheques) along with the barriers (behavioral and functional) they faced in uptake and usage of cashless solutions.
Blog
Getting it right: Why counting mobile money agents accurately matters
Financial access is the foundation of financial inclusion. A person cannot decide to use a financial service until it has been extended within their reach. Central to measuring access to finance is the number of physical locations in a country where a person can use financial services. Historically, these access points have included bank branches and ATMs. However, with the GSMA’s State of the Industry Report 2016 reporting that 92 countries now offer mobile money services, it is important to measure the number of agent outlets offering these services.
Counting agent outlets in a country is complicated. In fact, many in the industry may be surprised to learn that there is no consensus on these numbers — not even in countries leading the world in digital finance. This is a consequence of having two different methodologies for arriving at outlet statistics, yielding widely disparate results. The first is a series of censuses conducted as part of the Bill and Melinda Gates Foundation-funded FSP Maps project, which sought to geo-locate all agent outlets in six countries. The second approach aggregates agent numbers providers submit to their respective regulators (as well as to GSMA, in some cases).
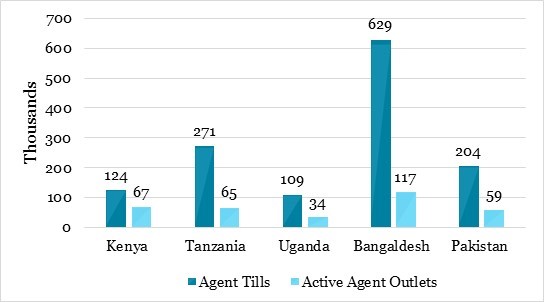
While both methodologies have weaknesses, the bigger issue is that they are designed to measure different statistics. Therefore, we have not been able to compare the results. For example, when the FinAccess geospatial mapping 2015 located 65,970 mobile money agent outlets in Kenya, after the regulator had published a figure of 123,703 agents in December 2014, it was hard to interpret either number.
The discrepancy is easily explained: A census counts up the number of visible and operational agent outlets, whereas providers report on the number of agent tills[1] they have registered on their books. The distinction between active agent outlets and total agent tills is crucial for measuring access, for two important reasons. First, in two-thirds of countries where mobile money is offered, multiple providers are serving the market. Often multiple providers distribute their services through the same agent outlet. Consequently, when regulators aggregate provider reports, many agent outlets are counted multiple times. Second, from the perspective of access, the only tills that matter are those being used (active tills), and while GSMA calculates inactivity rates, very few regulators publish figures disaggregated by activity.
It would seem that FSP Maps statistics are more appropriate for measuring access to finance, but they present challenges as well. The first is that they are only available for a couple of years, in a handful of countries. The second is that to date we have not been able to reliably gauge their accuracy. In a new paper titled, “Agents Count”, authored by The Helix Institute of Digital Finance, we make the first attempt to reconcile these numbers and garner consensus around the total number of active agent outlets in five key countries: Bangladesh, Kenya, Pakistan, Tanzania and Uganda.
Our approach adjusts the total number of agent tills that respective regulators report to account for inactivity and non-exclusivity. We use the best available estimates of country-level activity rates and measurements of non-exclusivity collected by The Agent Network Accelerator (ANA) project. In doing so, we find FSP Maps census numbers to be accurate, and the total number of active agent outlets in the five leading digital finance countries to be only 25.6 per cent of the regulator reported figures. This is important, as our literature review shows that it has been popular in the industry to use regulator figures to report the number of agent outlets in a country.
Figure 1. Agent Tills vs. Active Agent Outlets
The importance of measuring access to digital finance
In the paper, Fighting Poverty, Profitably (2013), The Gates Foundation makes four main recommendations to the industry, the first of which is to create baseline statistics in the industry to better measure impact. Insights from “Agents Count” suggest that the industry has overestimated the number of operational agent access points in leading countries by a factor of four. In a 2014 report by The World Bank, The Gates Foundation, and The Better than Cash Alliance for the G20, titled, The Opportunities of Digitalizing Payments, authors noted: “Providing physical access to financial services or cash-in/out points and ensuring sufficient liquidity at access points, including in rural areas, remain the core challenges in moving toward digital payments.”
To address this challenge we still have many strategic operations work to execute on the ground. Now that we have a better understanding of financial access in key countries, we must track our efforts by accurately measuring progress. Many of the leading organisations in the industry already understand this, but still, lack the data needed to move forward. This missing data underpins the efforts of key financial inclusion initiatives, including:
1. Global Partnership for Financial Inclusion (GPFI) – In 2016, the G20 updated its list of Financial Inclusion Indicators to include digital financial services. The Access Indicators section now contains the indicator 11D: agent outlets per 100,000 adults. However, the data source listed for 11D is the IMF FAS Survey which compiles regulator statistics, and therefore represents agent tills, not agent outlets.
2. The World Bank is spearheading a program called, Universal Financial Access by 2020 (UFA2020). One of the major goals of the program is to increase access points by 25 per cent by 2020. To measure its progress, it has added a new module called “Accounts and Access” to the World Bank Global Payments Systems Survey (GPSS). This module includes supply side measurements of access points and has specific metrics for agents. However, the GPSS also obtains its data from regulators, so it will not be able to provide accurate data on agent access points to UFA2020.
3. The Alliance for Financial Inclusion (AFI) has a working group of regulators called, The Data Working Group (FIDWG), which published a list of financial inclusion core indicators (2013) for regulators. Indicator 1.1 in the Access section recommends that regulators measure the “number of access points per 10,000 adults…” While this indicator does not provide instructions for how to do this, it does define an access point as a “physical entity where an individual can perform cash-in and cash-out transactions.” Many regulators will not be able to measure these physical entities using current data collection methods.
4. The UNCDF’s Mobile Money for the Poor (MM4P) program works to increase digital financial inclusion in eight countries across Africa and Asia. In the MM4P theory of change, one of the key indicators of advancement from the expansion to the consolidation stage of development is the number of active agents per 100,000 adults. Given this data is not currently available, the MM4P will have to invest in data collection in its target countries.
The Future of Measuring Access to Digital Finance
Past analyses based on regulator figures, compiled in this manner, have severely overestimated the level of financial access in respective countries. While the newly released paper provides clarity on the number of agent outlets in five key countries, it does not cover many other countries of interest, and the methodology relies on research not currently set to continue. This is problematic because all efforts to extend financial inclusion around the world need an accurate baseline measurement of the number of agent outlets and will require tracking this metric in the future to measure progress against their goals. To ensure this happens, plans need to be made now. In another blog, we outline our recommended steps for doing so.
Please find a link to the full text of the new report: “Agents Count: The True Size of Agent Networks in Leading Digital Finance Countries”.
Note: This blog originally appeared on GGAP’s Microfinance Gateway. The Microfinance Gateway is a global resource on financial inclusion.
[1] Till is a provider-issued registered “line”, either a special SIM card or a POS machine, used to perform enrollment, cash-in and cash-out transactions for clients.
Targeting agent activity to increase returns

The dormancy scourge
Every year the GSMA State of the Industry Report reveals that a large proportion of mobile money agents are not active (e.g. 47% were inactive in 2016). Reasons for inactivity fit in two buckets: either the agent has not begun operations, or they have, but then stopped conducting business.[1] The first category mainly consists of tills[2] that have been activated by the provider but are still awaiting the agent to start operations. Often this delay results from agents lacking enough training to understand the mechanics of the business. The second includes agents who have stopped offering provider services. Some could not make enough revenue to justify investment in float or lost interest in the business for other reasons.
Whatever the cause, inactivity means that providers are losing money on recruiting and training agents who do not generate business. Further, high dormancy rates can hurt providers’ brand and undermine customers’ trust in the service, ultimately hampering adoption and usage. Therefore, rather than recruiting and hoping for the best, providers should track their agent inactivity carefully to understand its causes and remedies. Equipped with this information, providers could ensure agents stay active or reactivate dormant tills, enabling them to cut recruitment and on-boarding costs.
How to track activity?
Five years ago, GSMA has flagged the lack of consensus on the definition of agent activity, revealed by the Global Adoption Survey of Mobile Financial Services. In-State of the Industry: Results from the 2012 Global Mobile Money Adoption Survey, GSMA observed that, while over 60% of respondents used a definition of, “at least one transaction in the past 30 days,” there were many variants. In addition to transaction volumes, some providers also took into account operational elements like being “‘able to’ perform transactions”, having “a sufficient balance to conduct transactions”, and in a few cases “sufficient branding of the agent outlet and quality of service at the point of sale.”
To the best of our knowledge, GSMA has proceeded using the 30-day active rate, but there has been no formal alignment of the definitions across the industry.[3] While from an industry perspective having a single definition of “active” is important to benchmark growth, from a strategic operations standpoint, a meaningful definition of agent activity will be based on the sustainability of the agency business. Providers might define active agents as ones performing enough transactions to cover their operational costs. Operational costs and commission structures differ by provider, so will their definition of active agents. Invariably, though, all providers will measure transactions rates on a daily basis.
How active are the profitable agents?
To better understand the relationship between transaction levels and agent profitability, we conducted a series of analyses using The Helix’s Agent Network Accelerator surveys with active mobile money agents (defined as having transacted at least once in past 30-days) in seven digital finance markets. Profits are calculated using information reported by business owners who chose to report both their revenues and expenses. As such, these should be taken as indicative and provide a starting point for discussions around re-conceptualising agent activity rate definitions.
Table 1 summarises the proportion of profitable tills by average daily transaction volumes. Immediately, we discover that very few tills that perform less than 5 transactions per day are profitable.[4] In fact, the majority of profitable tills are conducting at least 10 daily transactions, on average. Making a profit from providers’ tills requires more transactions in East Africa than in South Asia. In Bangladesh, greater profitability associated with low daily transactions can probably be explained by lower operating expenses (in part thanks to doorstep liquidity delivery). In Pakistan, it is probably thanks to high commissions resulting from competition.
Table 1. % of profitable tills falling within a specified transaction band
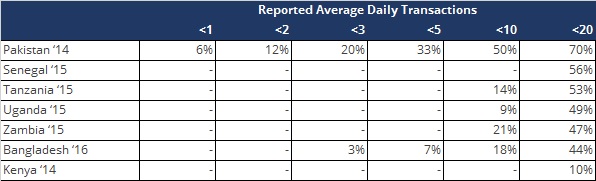
Source: calculated using agent-reported average daily transactions from Agent Network Accelerator (ANA) Surveys. – means the figures were suppressed due to low sample count (N<30).
Are active agents profitable?
We also examined the proportion of tills that are profitable within a given transaction band, using all agents operating within that band as the denominator (Table 2). In Africa, over a third of tills that conduct under 10 transaction per day are unable to break even. Moreover, only around two-thirds of tills conducting 10 to 20 daily transactions are making a profit. The story is somewhat different in Bangladesh and Pakistan, where a large majority of tills performing fewer than 5 transactions per day on average are profitable.
Table 2. % of tills profitable by average daily transaction level
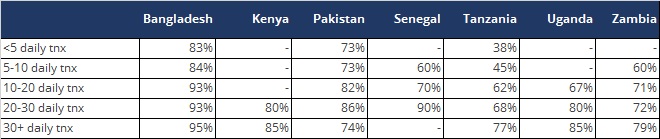
Source: calculated using agent-reported average daily transactions from Agent Network Accelerator (ANA) Surveys. – means the figures were suppressed due to low sample count (N<30).
In sum, our analysis shows that in Africa agent tills performing on average less than one transaction per day are unable to break even. In South Asia, where operating costs are lower, only a small percentage of profitable agents survive on an average of less than one transaction per day. Qualitative research in India and Kenya shows that some agents might continue investing in float hoping the business will take off or because they value providing a service to the community or being associated with a large financial institution. Nevertheless, we urge providers, and the industry as a whole, to recognise that a truly meaningful definition of agent activity would revolve around the sustainability of the agency business.
Summary advise for providers
- Tracking agent activity can help providers maximise the return on investment in agent recruitment, on-boarding and training. Moreover, when defining performance metrics, providers should probably target an average of 5-10 daily (rather than monthly) transactions in Africa and 2-3 daily transactions in Bangladesh and Pakistan.[5]
- To develop their own active definitions, providers can use their agent monitoring system to collect statistics on agent operational costs. Agent revenues should be readily available internally. Active agents should then be defined as those performing enough transactions to break even.
- Tracking agent distribution across transaction bands (as done above) can help providers optimise their investment in monitoring and support activities. Monthly KPIs around the proportion of agents who should be doing 10, 20, and 30 transactions per day can help focus agent network managers’ efforts. Providers could also identify consistently high performing agents who would be eligible for supplementary services (e.g. credit lines, extra liquidity support, bonuses).
[1] We are not aware of publicly available data sources that would allow us to gauge the relative size of these two buckets. Agent censuses generally do not find tills that are not being used. The Agent Network Accelerator surveys are also unable to accurately represent inactive tills and dormant outlets.
[2] Agent till is a provider-issued registered “line”, either a special SIM card or a POS machine, used to perform enrolment, cash-in and cash-out transactions for clients.
[3] GSMA uses sophisticated mathematical models to extrapolate these rates from incomplete data, in part because not all survey respondents are submitting activity rate statistics in line with the 30-day definition.
[4] In fact, most of the table cannot be displayed because the sample count is too low.
[5] In some markets, like India and Pakistan, shop owners may turn into agents for 5-7 days every month to supplement their income by distributing G2P payments. Such agents would conduct far few transactions outside the G2P pay-out times and should be monitored for activity during these periods.
Defining terms and options for measuring access to digital finance

The first blog in this series explained that currently, countries do not have systems for counting the number of active agent outlets on their territories. This must be remedied as this statistic is fundamental for measuring access to finance, with leading financial inclusion efforts around the world planning to use it as an indicator of progress.
The reasons why we have not been able to accurately measure this in the past are two-fold. First, as an industry, we have not taken the time to define key terms like “agents” or “activity”. This has led to confusion over what is being measured, and how the resulting metrics can be used. The second is that we have not been collecting the data necessary to accurately and consistently measure key indicators. This article summarizes recommendations from a newly released paper titled “Agents Count”, containing some initial suggestions for addressing these issues.
Key Definitions for Agent Networks
To measure access to finance, we need to first count (and geo-locate) all active agent outlets. This would allow us to understand the number of physical locations offer financial services in a geographical area or in relation to a population. This indicator can then be used to track progress across time periods or places.
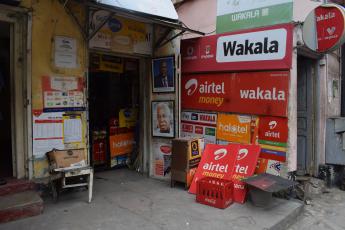
To date, the industry has been using two different methods to count agents. The first is to add up the number of agent tills, which are special SIM cards or POS machines agents use to perform transactions. The other is to count the number of physical locations in which these tills are used. Unfortunately, much of the literature uses a generic term “agent”, leaving the reader unsure of what is being discussed.
Further, the counting of tills is much more common: it is what regulators, GSMA, the IMF and the World Bank do. The reality in most countries, however, is agent locations often carry multiple tills. Consequently, the total till count is much higher than the total number of agent outlets. Presenting agent tills rather than outlets leads to overestimates of financial access. Hence, when discussing access to finance provided via agents, we need to draw the distinction between “agent tills” or “agent outlets” and be clear which figures we use.
Beyond this, from access to finance perspective, we should only care about tills or outlets that are actually operational and offering services. Alas, here again, we lack a consensus on what defines an agent (till or outlet) as active. Some organisations use a 30-day rate, while others use a 90-day rate. We recommend that the industry uses 30-day rates at a bare minimum since even one transaction per month is unlikely to earn the agent enough commission to motivate her to continue investing in float. In the paper, we also suggest that providers maintain an even more stringent definition, which we discuss.
Methods for Collecting Data on Agent Outlets
Hopefully, the industry will move to standardise the two key definitions above, but even once there is clarity on definitions, we need data to measure corresponding indicators. There are three main options for collecting this data, all with their own pros and cons.
- Agent censuses can be collected regularly to count the number of agent outlets in a country. The obvious benefit of this method is that it is easy to understand, our calculations in the paper validate the accuracy of existing censuses. The downside is, given how costly and time-consuming they are, we doubt that most countries would conduct them regularly.
- Compliance data cum agent surveys is a somewhat cumbersome but cheaper alternative. Regulators could insist on collecting 30-day active till statistics from providers. These figures could be adjusted down using the information on the number of tills agent outlets carry obtained through nationally representative agent surveys, using formulas outlined in “Agents Count”. The Helix Institute has conducted such surveys in eight countries, demonstrating that while this option also involves fieldwork, it is much more economical in terms of time and money compared to a census. The benefit of this methodology is it builds on compliance data already being collected by regulators and requires limited additional fieldwork. Further, our paper shows that the calculations are just as accurate as completing a full census. The con is the need for regular data collection as levels of multiple tills outlets host keeps evolving.
- Geo-located agent registries could be a sustainable long-term solution, which builds on a census and is regularly updated. Regulators could develop specialised data collection apps, which would enable automated updates to the registry. Such apps could pull in data from providers’ internal systems, including 30-day activity rates and any other compliance data required. While this option is promising, the major con is it has not been implemented. The Bank of Tanzania is currently working on a similar application but is yet to launch. The major advantage is that much more could be done with this data in terms of geo-spatial analysis of access to finance.
Recommendations for Measuring Access to Digital Finance
- The industry needs to adopt standardised definitions for both agent outlet and agent till to eliminate any confusion. Vetted through discussions with key international organisations, the following definitions can form the basis for industry consensus on agent terminology:
- Agent till: a provider-issued registered “line”, either a special SIM card or a POS machine, used to perform enrollment, cash-in and cash-out transactions for clients.
- Agent outlet: a physical location that carries one or more agent tills, enabling it to perform enrollment, cash-in and cash-out transactions for clients on behalf of one or more providers. Agent outlets may also have other businesses and support functions.
- Registered agent is a term used in the industry to refer to agent tills. This term should be avoided as it has been confusing in the past.
Moreover, the industry should agree on a standard definition of “active”, which we recommend being “at least one transaction in past 30-days”.
- Regulators should go farther in collecting and disseminating financial inclusion data. At the minimum, they should insist that providers also report agent till 30-day activity rates. While many already do, all regulators should share agent data on their websites, as well as with the IMF and the World Bank for their respective FAS and GPSS reports.
- Public sector organisations should ensure progress against financial inclusion targets is measured accurately. Organisations working to promote financial inclusion should coordinate to determine the best methods for collecting data on key progress indicators. Then, they should provide the technical and financial support needed to ensure the appropriate data are collected widely, accurately, and frequently.
Please find a link to the full text of the new report: “Agents Count: The True Size of Agent Networks in Leading Digital Finance Countries”.
Making Digital Financial Services relevant in the lives of users – Assessment of money management tools and practices in Côte d’Ivoire.

Although the digital finance market is growing in Côte d’Ivoire, the activity rate of subscribers remains low.
Clients do not use digital financial services because the current offering does not meet their financial management practices and needs. This study focuses on the identity of the low activity rate of financial users and it specifically proposes to understand the financial management practices and tools of the Ivorian population and provide Digital Finance Ecosystem Players for Market-Oriented Product Designs.
Public Distribution System Reforms and MicroSave
MSC has a reputation for fair and independent work and brings a unique and fresh perspective in the form of field insights. We started our pilots on DBT in PDS in Chandigarh, Dadra-Nagar Haveli and Puducherry on the basis of MSC’s findings. We are quite happy with MSC’s engagement with us and have benefitted from the entire process.