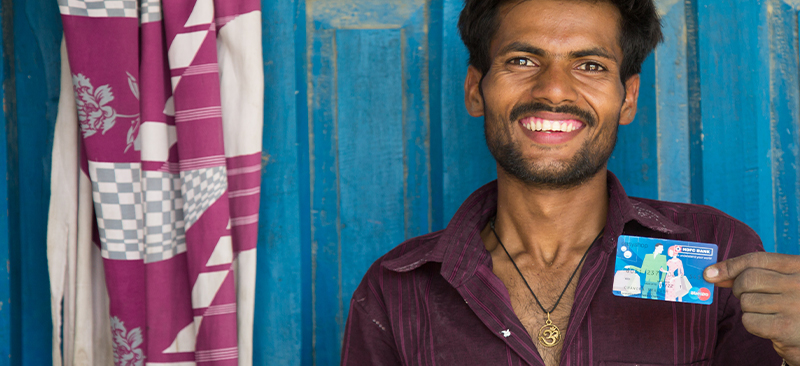
From July 2016 to August 2017 Microfinance Opportunities (MFO) conducted the Garment Worker Diaries project in three countries—Bangladesh, Cambodia, and India. In total, MFO’s local research partners collected data from 180 garment workers in each country, each week for a year.
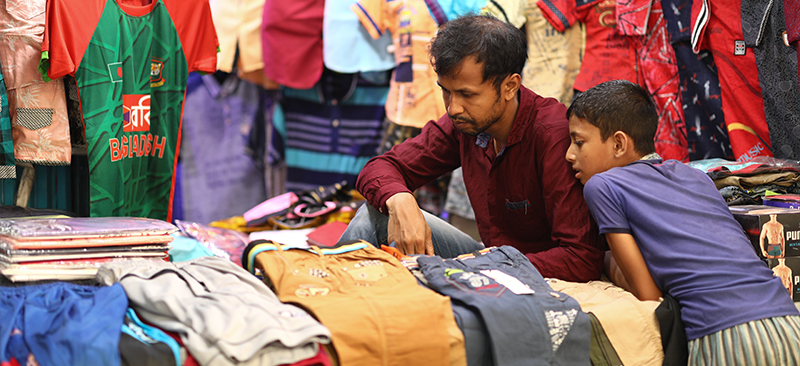
The researchers collected data on how much the workers earned and spent each week, as well as how many hours they worked and the conditions in their factories. This blog is the first in a series of three blogs on what MFO found through its research. We begin with the findings from Bangladesh, with subsequent blogs on Cambodia and India.